
- Title
-
Changes in aggression and locomotor behaviors in response to zinc is accompanied by brain cell heterogeneity and metabolic and circadian dysregulation of the brain-liver axis
- Authors
- Yu, F., Luo, H.R., Cui, X.F., Wu, Y.J., Li, J.L., Feng, W.R., Tang, Y.K., Su, S.Y., Xiao, J., Hou, Z.S., Xu, P.
- Source
- Full text @ Ecotoxicol. Environ. Saf.
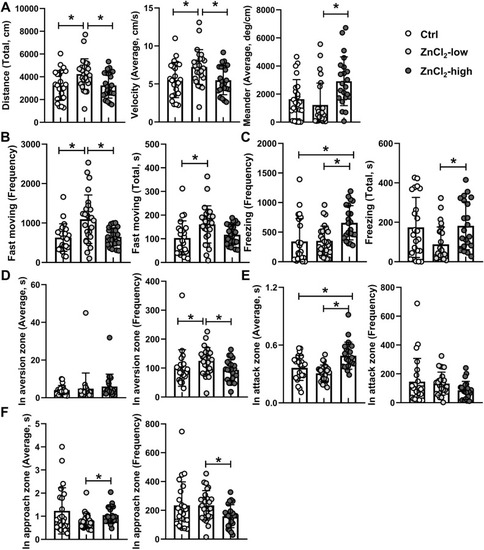
Fig. 1. Comparison of behavior between control and zinc chloride-exposed groups in the Mirror biting test. The total swimming distance, average velocity and meander (A); the frequency and total duration of freezing behaviors (B); the frequency and total duration of fast moving behaviors (C); the frequency of entry and total duration in the aversion zone (D); the frequency of entry and total duration in the attack zone (E); the frequency of entry and total duration in the approach zone (F). “*” indicates significant difference between two groups (p < 0.05, n ≥ 22). |

Fig. 2. Heterogeneity and homogeneity of gene expression in brain cells after zinc chloride exposure. Heterogeneous expression of slc39a1 (Zinc transporter, A), gabarabp (GABA receptor-associated protein, B), ncalda (neurocalcin delta, C), and slc6a1b (GABA transporter, D). Homogeneous expression of cxcr4b with cxcl12a (chemokine ligand 12, chemokine receptor 4b, E), cxcl8a (chemokine ligand 8a, F), il1β (interleukin 1β, G), and tnfβ (tumor necrosis factor β, H) in ZnCl2-low and ZnCl2-high groups. The different cell clusters are color coded. |

Fig. 3. Enriched biological processes in brain cells after zinc exposure. Venn diagrams of enriched biological processes of Ctrl, ZnCl2-low, and ZnCl2-high groups (A); significantly enriched signatures within ZnCl2-low and ZnCl2-high groups (B and C). Details of enrichment analyses of Figs. B and C are shown in Table S3. Comparison of significantly enriched biological processes among Ctrl, ZnCl2-low, and ZnCl2-high groups (ion transport (D), neuron functions (E), immune functions (F), response to external stimulus (G)). GO:0015672, monovalent inorganic cation transport; GO:0006812, cation transport; GO:0030182, neuron differentiation; GO:0048699, generation of neurons; GO:0048666, neuron development; GO:0002376, immune system process; GO:0009605, response to external stimulus. The screening criteria of the enrichment analyses were Padj < 0.05 with enrichment genes ≥ 3 or p value < 0.05 with enrichment genes ≥ 5. |

Fig. 4. Functional homogeneity of astrocytes in ZnCl2-low and ZnCl2-high groups after zinc exposure. Homogeneity of enriched biological processes in astrocytes of ZnCl2-low cluster 4 and ZnCl2-high cluster 3 (defense responses and immune responses, A). Venn diagrams of DEGs in both astrocyte clusters (B); Volcano plot of DEGs that overlap between the two astrocyte clusters (C) (top DEGs associated with immune functions are labeled); enriched functional processes of the overlapping DEGs in both astrocytes clusters (D); a proposed mechanism in response to zinc toxicity in astrocytes (E). GO:0006952, defense response; GO:0009611, response to wounding; GO:0042060, wound healing; GO:0050900, leukocyte migration; GO:0030593, neutrophil chemotaxis. The screening criteria of enrichment analyses were Padj < 0.05 with enrichment genes ≥ 3 or p value < 0.05 with enrichment genes ≥ 5. Otherwise, the p value is shown in the figure. |

Fig. 5. General hepatic transcriptome signature after zinc exposure. Venn diagrams and heatmap of DEGs (A and B); signature DEGs associated with antioxidant physiology and autophagy in ZnCl2-low group (C and D) and antioxidant physiology in ZnCl2-high group (E); significantly enriched and up-regulated functions in ZnCl2-low and ZnCl2-high groups (F); significantly enriched and down-regulated functions in ZnCl2-low and ZnCl2-high groups (G) The screening criteria of enrichment analyses were p < 0.01 with enrichment genes ≥ 5 or 0.05 < p ≤ 0.01 with enrichment genes ≥ 10. Details of enrichment analyses are shown in Table S4. |
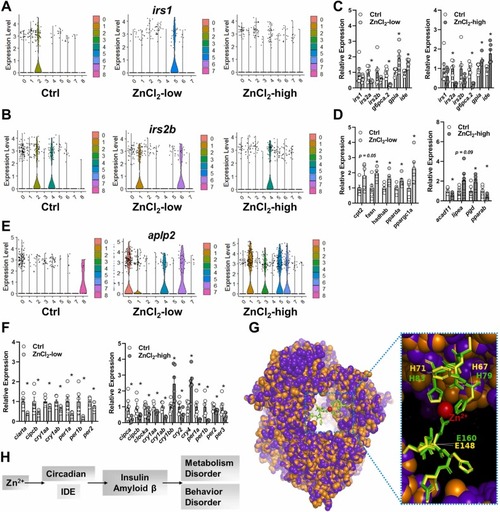
Fig. 6. Transcriptional signature of genes related to circadian and metabolic functions in the brain and liver. Signature DEGs associated with insulin functions in the brain (A and B) and liver (C); signature DEGs associated with lipid metabolism in the liver (D); signature DEGs associated with neurodegenerative diseases (aplp2, amyloid beta precursor like protein, E) signature DEGs associated with circadian rhythm in the liver (F); alignment of zebrafish IDE (purple) with human IDE (orange) with the zinc binding pockets shown (zebrafish: yellow; human: green, G); a potential functional integration of circadian and metabolism signatures between the liver and brain (H). In figure G, the SWISS-MODEL of zebrafish IDE to human IDE (PDB ID: 2JG4.1) was used as template. |