
- Title
-
Unmyelinated sensory neurons use Neuregulin signals to promote myelination of interneurons in the CNS
- Authors
- Lysko, D.E., Talbot, W.S.
- Source
- Full text @ Cell Rep.
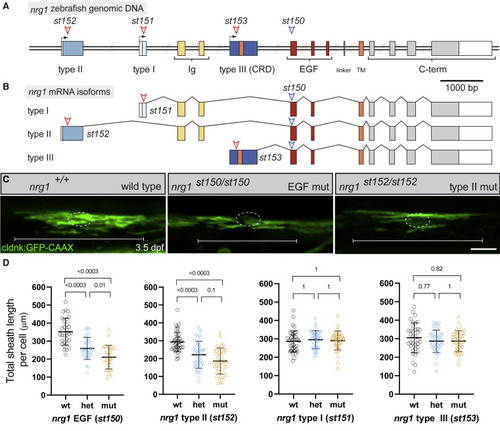
nrg1 type II signals are required for normal myelination in the spinal cord (A) Diagram of the zebrafish nrg1 locus. Colored rectangles indicate coding exons; open rectangles indicate UTRs. Arrows indicate alternative transcriptional start sites. Exon length is to scale; double slashes indicate intronic regions that are not to scale. Red arrowheads indicate sgRNA targets in 5′ isoform-specific exons and locations of corresponding mutations. Blue arrowhead indicates sgRNA target used to generate st150 mutation in the EGF domain, which is predicted to eliminate function of all nrg1 isoforms. (B) Diagram of the mRNA splicing of nrg1 isoforms, illustrating the isoform-specific nature of 5′ exons and chosen sgRNAs. (C) Confocal images of oligodendrocytes in the dorsal spinal cord at 3.5 dpf labeled using the claudink:GFP transgene. Wild-type fish have normal sheath parameters, while oligodendrocytes (OL) in EGF and type II mutants have reduced myelin. A dotted circle indicates the OL cell body, while brackets indicate the breadth of a single OL. Scale bar, 20 μm. (D) Quantification of total myelin sheath length produced by individual oligodendrocytes in nrg1 EGF and isoform-specific lines. OLs in nrg1 EGF and type II mutants (mut) make significantly less myelin per OL than in wild-type (wt) animals, while no difference is observed in nrg1 type I or III mutant animals. Animals were genotyped after imaging. Error bars represent mean ± SD. A t test was used to assess significance, and p values were adjusted for multiple comparisons. Each point represents one OL; ≥ 30 OLs per category from ≥4 animals per category; one representative experiment shown from three replicates. Figures 1A and 1B modified from Lysko et al.34 See also Figures S1 and S2. |
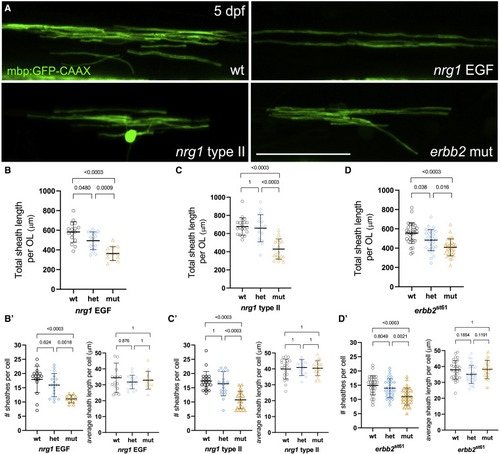
nrg1 type II is required for normal myelin sheath number in the spinal cord at 5 dpf Myelin sheaths analyzed using transient transgenic expression of mbp:GFP construct to scatter label oligodendrocytes in the dorsal spinal cord at 5 dpf. (A) Myelin sheath number is significantly reduced in nrg1 EGF and type II mutants, similar to the reduction seen in erbb2 mutants. Scale bar represents 25 μm. (B and C) Total sheath length per oligodendrocyte (OL) is significantly reduced in nrg1 EGF and nrg1 type II mutants. (D) A similar reduction in total sheath length is observed in erbb2 mutants. (B’–D’) This reduction in total sheath length is driven by a reduction in sheath number per oligodendrocyte, rather than a reduction in sheath length. Animals were genotyped after imaging. Error bars represent mean ± SD. A t test was used to assess significance, and p values were adjusted for multiple comparisons. Each point represents one OL; ≥ 12 OLs per category from ≥4 animals per category; one representative experiment shown from three replicates. |

nrg1 type II is required for normal myelination of diverse neuronal classes (A) Illustration of spinal cord neurons assessed with the myelin reporter. RS neuron cell bodies reside in the hindbrain and project posteriorly toward the tail (orange). CoPA neurons reside in the dorsal spinal cord and project anteriorly to the hindbrain (blue). RB sensory neurons reside in the dorsal spinal cord, receive touch stimulation via their sensory arbor, and project both anteriorly to the hindbrain and posteriorly (green). (B) The UAS:GFP-2A-tdTomato-contactin myelin reporter construct expresses GFP along the entire axon, allowing characterization of neuronal type, while tdTomato-contactin is excluded from ensheathed segments of the axon, allowing assessment of myelination status; thus myelin sheaths appear green in merged images. (C) Quantification of myelination status in CoPA and RS neurons. Percent of neurons that are myelinated indicated by bars, inset numbers indicate number of neurons assessed as myelinated or unmyelinated. For RS neurons, ≥21 neurons per genotype, ≥15 animals per genotype, 99 animals total; for CoPA neurons, ≥14 neurons per genotype, ≥11 animals per genotype, 49 animals total. Fisher’s exact test was used to assess significance. (D) Myelin sheath pattern comparison between wild-type and nrg1 type II mutant CoPA neurons. Arrowheads indicate myelin sheaths along the CoPA subject neuron. Dotted white lines indicate the position of CoPA cell body on the contralateral side of the spinal cord, which is not visible in this image projection. The asterisk indicates CoPA cell body in nrg1 type II mutant image, while open arrowheads indicate the unmyelinated axon. Dashed gray lines indicates dorsal and ventral bounds of the spinal cord. (E) Myelin sheath pattern comparison between wild-type and nrg1 type II mutant RS neurons. Arrowheads indicate myelin sheaths along the subject wild-type RS neuron, while open arrowheads indicate an unmyelinated RS axon in a nrg1 type II mutant. A dorsal unmyelinated RB neuron (cell body, #; sensory arbor, arrow) sends projections posteriorly and also anteriorly to the hindbrain. Animals were genotyped after imaging. Scale bar, 50 μm. See also Figure S3 |

Unmyelinated RB sensory neurons express nrg1 type II (A) Diagram indicating location of 3 kb regulatory element and reporter construct design. Colored rectangles indicate coding regions; open rectangles indicate UTRs. Arrows indicate transcriptional start sites. (B) Endogenous nrg1 type II mRNA detected by RNAScope in situ hybridization at 24 hpf. White arrowheads mark expression in dorsal spinal cord. Black arrowheads mark expression in the region of motor neurons in the ventral spinal cord. Expression is also evident in the notochord (nc). Dotted lines mark the dorsal and ventral extent of the spinal cord in the posterior trunk and anterior tail. Scale bar, 100 μm. (B’) In the same animal as (B), GFP mRNA from the nrg1 type II reporter transgene was also detected by RNAScope in situ hybridization. (B’’) Merge of (B) and (B’). Co-expression of GFP mRNA with endogenous nrg1 type II mRNA is observed in both the dorsal spinal cord and notochord. Representative images from five replicate experiments. (C) Co-expression of endogenous nrg1 type II mRNA and GFP mRNA from the nrg1 type II reporter transgene. White arrowheads indicate putative cell bodies of three GFP-expressing Rohon-Beard (RB) sensory neurons, which also express endogenous nrg1 type II mRNA. Black arrowheads indicate two areas of endogenous nrg1 type II mRNA expression in the region of motor neurons. Scale bar, 50 μm. (D) GFP from the nrg1 type II reporter is expressed prominently in early-born Rohon-Beard (RB) neurons in the dorsal spinal cord (arrowheads; colocalized with the pan-neuronal marker NBT:dsRed45)and transiently in the notochord (nc) at 22 h postfertilization. Scale bar, 200 μm. (E) Large, GFP-expressing RB neurons send axons (arrowhead) anteriorly and posteriorly via the dorsal longitudinal fasciculus (DLF). Reporter expression also occurs in the posterior lateral line nerve (asterisk), which grows posteriorly at 1.5 dpf. Scale bar, 50 μm. (F) The nrg1 type II reporter is expressed in neurons with large cell bodies and sensory arbors (arrow) characteristic of RB neurons at 1.5 days post fertilization (1.5 dpf). White arrowheads indicate the DLF as in (E). Scale bar, 50 μm. (G) GFP-expressing axons from RB neurons (white arrowhead) are near oligodendrocytes (black arrowheads) in the dorsal spinal cord. Scale bar, 50 μm. (H) GFP-expressing axons in the DLF (arrowhead) project anteriorly into the hindbrain (hb). GFP-expressing lateral line nerve descends from the posterior lateral line ganglion (#). Scale bar, 200 μm. |
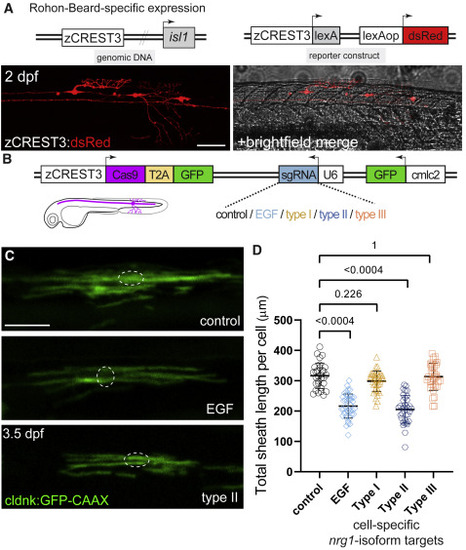
nrg1 type II signals are required in RB neurons for normal myelination in the spinal cord (A) Illustration showing the location of the zCREST3 upstream of the islet1 gene. In transient transgenic experiments, zCREST3:dsRed shows exclusive expression in RB neurons with characteristic sensory arbors. Scale bar, 100 μm. (B) Diagram of cell type-specific CRISPR construct design, allowing RB expression of Cas9, and ubiquitous expression of EGF or isoform-specific nrg1-targeted sgRNAs. (C) Confocal images of oligodendrocytes (OL) in the dorsal spinal cord labeled using the claudink:GFP transgene. A dotted circle indicates the OL cell body. Scale bar, 20 μm. (D) Quantification of total myelin sheath length produced by individual OLs in animals expressing RB-specific Cas9, with indicated nrg1 EGF and isoform-specific sgRNAs. Each point represents an individual OL; at least 30 OLs quantified from ≥3 animals per category; one representative experiment shown from three replicate experiments. Error bars represent mean ± SD. A t test was used to assess significance, and p values were adjusted for multiple comparisons. See also Figures S4, S5, and S6. |

erbb2 receptor is required in neurons, but not oligodendrocytes, for normal myelination in the spinal cord (A) Confocal images show that claudink:GFP-labeled oligodendrocytes (OL) in erbb2 mutants generate less myelin than wild-type controls. Scale bars, 20 μm. (B) Quantification of myelin produced by individual OLs in animals wild-type, heterozygous, or mutant for erbb2st61. OLs in animals lacking erbb2 produce significantly less myelin. Each point represents one OL; at least 40 OLs analyzed from ≥6 animals per genotype; one representative experiment shown from three replicates. Animals were genotyped after imaging. (C) Diagram of cell type-specific CRISPR construct design, allowing expression of Cas9 in OLs (claudin), all neurons (NBT), or RBs (LSEC), and ubiquitous expression of erbb2-targeted sgRNA. (D) Confocal images of oligodendrocytes in the dorsal spinal cord labeled using the claudink:GFP transgene. Dotted circle indicates the OL cell body, while brackets indicate the breadth of a single OL. (E) erbb2 cell type-specific CRISPR quantification. Total myelin sheath length produced by individual oligodendrocytes in animals expressing Cas9 in neurons is significantly less than in the other conditions. No significant change in myelin production occurred in animals with erbb2 knockdown in RB neurons or oligodendrocytes. Each point represents one OL; at least 15 OLs quantified from ≥4 animals per category; one representative experiment shown from three replicates. Error bars represent mean ± SD. A t test was used to assess significance, and p values were adjusted for multiple comparisons. See also Figures S5 and S7. |