
- Title
-
Transcriptomic Interaction between Young Fecal Transplantation and Perfluorobutanesulfonate in Aged Zebrafish Gonads
- Authors
- Tang, L., Li, J., Sun, B., Bai, Y., Zhou, X., Chen, L.
- Source
- Full text @ Toxics

Experimental design (A) and a summary of the differential genes in the gonads of zebrafish after exposure to PFBS (0 and 100 μg/L) with or without the transplantation of young donor feces. The number of differential genes of significantly increased or decreased abundance in male (B) and female (C) zebrafish. A Venn diagram showing the common or unique genes among exposure groups in the male (D) and female (E). Values are presented as means of three replicates (n = 3). -, without; +, with. The two different shapes of the boxes indicate old and young fish, respectively (A). |

A heatmap showing the overall changes in differential genes among exposure groups in male (A) and female (B) zebrafish. Red and green colors stand for increased and decreased changes, respectively, compared to the aged−control abundance. Color intensity is proportional to the changing magnitude. Values are presented as means of three replicates (n = 3). |

Principal component analysis (PCA) in male (A) and female (B) zebrafish, with the input of differential genes based on the variance–covariance matrix. |

Correlation analysis between transcriptomic and qPCR results in male (A) and female (B) zebrafish. |
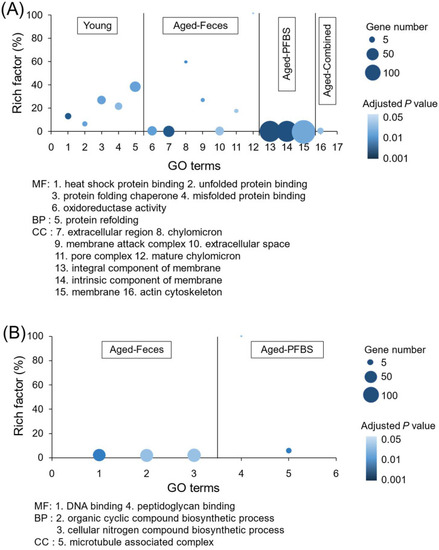
Significantly enriched GO terms (MF, molecular function; BP, biological process; CC, cellular component) in male (A) and female (B) zebrafish gonads after exposure to PFBS (0 and 100 μg/L) with or without the transplantation of young donor feces. Color intensity is proportional to the enrichment significance (adjusted p value). The circular area represents the number of inclusive genes. |

KEGG pathways of significant enrichment in male (A) and female (B) zebrafish gonads after exposure to PFBS (0 and 100 μg/L) with or without the transplantation of young donor feces. Color intensity is proportional to the enrichment significance (p value). The circular area represents the rich factor. |

The most significant gene interactive network for the aged-combined group in male (A) and female (B) according to R spider enrichment of differential genes. The colored node is labeled by the human homologs of differential genes, where the same color represents the enrichment along the same pathway. Only overrepresented pathways are colored. The number preceding the pathway denotes the hierarchy order. |