
Image
|
Figure Caption
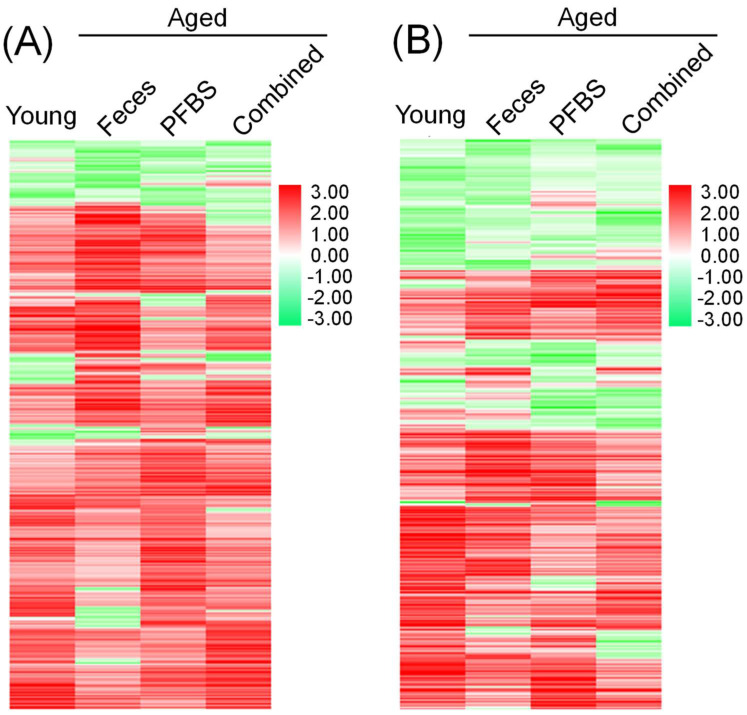
Figure 2 A heatmap showing the overall changes in differential genes among exposure groups in male (A) and female (B) zebrafish. Red and green colors stand for increased and decreased changes, respectively, compared to the aged−control abundance. Color intensity is proportional to the changing magnitude. Values are presented as means of three replicates (n = 3).
Acknowledgments
This image is the copyrighted work of the attributed author or publisher, and
ZFIN has permission only to display this image to its users.
Additional permissions should be obtained from the applicable author or publisher of the image.
Full text @ Toxics