FIGURE SUMMARY
Title

Development of a Combined Lipid-Based Nanoparticle Formulation for Enhanced siRNA Delivery to Vascular Endothelial Cells

Authors
He, Y., Bi, D., Plantinga, J.A., Molema, G., Bussmann, J., Kamps, J.A.A.M.
Source
Full text @ Pharmaceutics

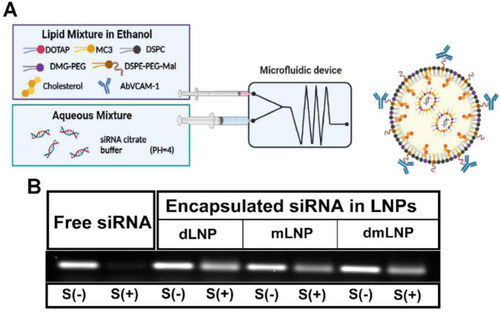
Preparation and characterization of LNP with different cationic lipid compositions. (A) Schematic representation of LNP preparation. (B) The agarose gel electrophoresis image of non-encapsulated siRNA and siRNA encapsulated in LNP. Intact free siRNA and three of LNP/siRNA samples were incubated with (+) or without (−) 40% serum (S) for 3 h at 37 ℃.

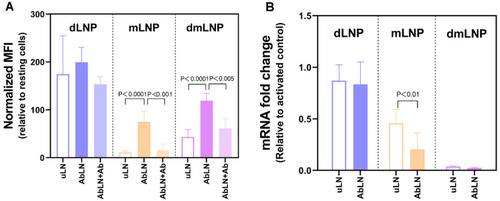
Endothelial association and transfection activities of three LNP formulations with different cationic lipid compositions. (A) Specificity and extent of cell association of LNP to HUVEC, as determined by flow cytometry. TNF-α-activated HUVEC were incubated with uLN or AbLN of three formulations for 3 h. The specificity of cell association to VCAM-1 was investigated by co-incubation with an excess of anti-VCAM-1 antibodies together with AbLN. Data are presented as normalized mean fluorescence intensity (MFI) ± SD values of three independent experiments. HUVECresting/HUVECactivated only = 1. (B) Transfection activities of uncoupled and antibody-coupled LNP formulations loaded with siRNARelA in activated EC. TNF-α-activated HUVEC were transfected with uLN or AbLN containing siRNARelA at 100 nM concentration for 48 h and next processed for qPCR as described in the Section 2. Data are shown as relative fold change in gene expression ± SD of 3 independent experiments.

Effect of the DOTAP/MC3 ratios in dmLNP formulations on cell association and transfection in activated HUVEC. (A) Endothelial association of dmLNP formulations with increasing DOTAP/MC3 ratios (5D/45M, 10D/40M and 25D/25M). TNF-α activated HUVEC were incubated with LNP for 3 h, and EC-associated-DiI fluorescence was determined by flow cytometry. Data are normalized MFI ± SD of three independent experiments. (B) SiRNA-based gene silencing in activated EC mediated by the LNP formulations with different DOTAP/MC3 ratios, at the siRNA concentration of 15 nM or 60 nM. Data are from 3 independent experiments and shown as mRNA fold change ± SD.

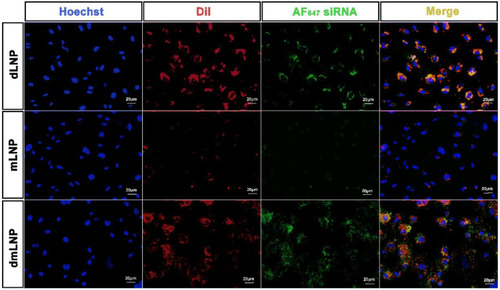
Intracellular release of siRNA from dLNP, mLNP and dmLNP (10D/40M) in EC. HUVEC were incubated for 6 h with three LNP formulations labeled with DiI (red) and loaded with AlexaFluo647-siRNA (green), the nuclei were stained using Hoechst 33,342 (blue). Presented datasets are representative fluorescence microscopy images of 2 independent experiments. Scale bar: 20 µm.

Ab-dmLNP/siRNARelA attenuates endothelial inflammatory activation after down-regulation of NF-κB P65 (RelA), which is as effective as lipofectamine. (A) The mRNA and protein levels of RelA after siRNARelA-based transfection mediated by different LNP systems and lipofectamine. (B) Gene silencing of inflammation-related genes VCAM-1, ICAM-1 and E-selectin, after LNP or lipofectamine-mediated RelA knockdown. Data are represented as mean values ± SD of 3 independent experiments.

Biodistribution of LNP and siRNA in zebrafish embryos at tissue-level view. (A) Schematic diagram of zebrafish microinjection. First, 1 nL of Dil-labeled LNP was injected into the duct of Cuvier of 54 hpf zebrafish embryos, and confocal images were taken at 1, 3, 12, 24 and 48 h after injection. Tissue-level images of LNP distribution in Tg (kdrl:eGFP) embryos were shown with the white boxes indicating LNP in the circulation. CHT-EC: caudal hematopoietic tissue endothelial cells, DLAV: dorsal longitudinal anastomotic vessel. ISV: intersegmental vessel. (B) The bright-field images of LNP biodistribution at multiple hpi (s). Macrophage-uptake of LNP is marked with red triangles, and extravasation of LNP is indicated by white rectangles. (C) The fluorescence images of the biodistribution of LNP (red) and siRNA (blue) at different time points. The zoomed-in images are displayed in the white squares. Scale bar of (B,C): 200 µm.

Effective in vivo GFP silencing mediated by the DOTAP/MC3 LNP/siRNA system (10D/40M) in Tg (kdrl: eGFP) zebrafish. Confocal microscopy images of GFP (scale bar: 200 µm) in (A) dmLNP containing siRNAGFP or siRNActrl (dmLNP/siRNAGFP vs. dmLNP/siRNActrl); (B) mLNP containing siRNAGFP or siRNActrl (mLNP/siRNAGFP vs. mLNP/siRNActrl); (C) Untreated group. (D) Quantification of GFP fluorescence in entire images by ImageJ (n = 7). The data represent the mean ± SD. *** p < 0.001according to one-way ANOVA, Tukey’s multiple comparisons test. Scale bar of (AC): 200 µm.

Acknowledgments
This image is the copyrighted work of the attributed author or publisher, and ZFIN has permission only to display this image to its users. Additional permissions should be obtained from the applicable author or publisher of the image. Full text @ Pharmaceutics