
- Title
-
Zbtb14 regulates monocyte and macrophage development through inhibiting pu.1 expression in zebrafish
- Authors
- Deng, Y., Wang, H., Liu, X., Yuan, H., Xu, J., de Thé, H., Zhou, J., Zhu, J.
- Source
- Full text @ Elife
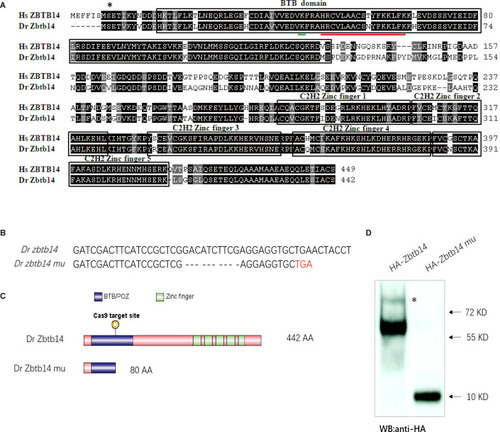
(A) Sequence alignment of. ZBTB14 and Zbtb14 proteins. Hs: Homo sapiens, Dr: Danio rerio. The conserved BTB domain and C2H2 zinc finger domains are boxed. *: The mutated serine identified in an acute myeloid leukemia (AML) patient. The putative SUMOylated lysine K40 and the nuclear localization signal (NLS) are underlined, respectively. (B) Schematic representation of Cas9 target site in the first exon of zebrafish zbtb14. The deleted nucleotides in the mutant gene are marked by hyphens. (C) Schematic representation of wild type (442 amino acids) and mutant Zbtb14 proteins (80 amino acids). (D) Western blot analysis of HA-tagged wild type and mutant Zbtb14 proteins expressed in HEK293 cells. * indicates the adduct band.
|
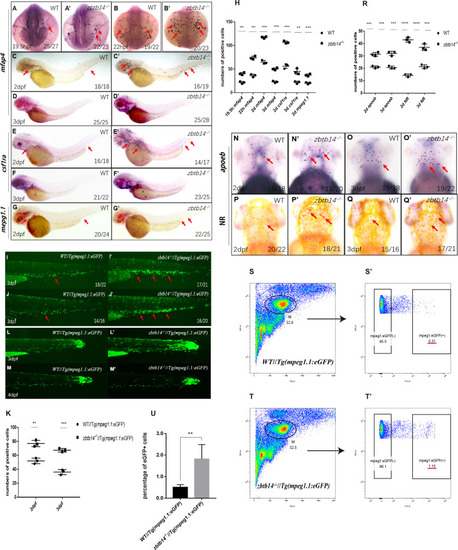
(A–G’) Whole-mount in situ hybridization (WISH) analyses of macrophage markers mfap4 (A–D’), csf1ra (E–F’), mpeg1.1 (G, G’) from 19.5 hr post-fertilization (hpf) to 3 days post-fertilization (dpf) in wild type (WT) and zbtb14-deficient embryos and larvae. Red arrows indicate the main positions of positive cells for each marker. n/n, number of embryos/larvae showing representative phenotype/total number of embryos/larvae examined. (H) Statistical results for A–G’ (Student’s t test, N=3, 14–28 embryos were used for each probe. Each dot represents the mean value of one experiment, which was obtained from the counts of all of the embryos/larvae in the same group. Error bars represent mean ± standard error of the mean (SEM). **p<0.01, ***p<0.001, ****p<0.0001). (I–J’) GFP positive cells were increased in zbtb14-/-//Tg(mpeg1.1:eGFP) embryos at 2 and 3 dpf. (K) Statistical results for I–J’ (Student’s t test, N=3, 14–22 larvae were used for each experiment. Each dot represents the mean value of one experiment. Error bars represent mean ± SEM. **p<0.01, ***p<0.001). (L–M’) GFP positive cells in both Tg(mpeg1.1:eGFP) and zbtb14-/-//Tg(mpeg1.1:eGFP) larvae can migrate to the wound. (N–Q’) apoeb and neutral red positive cells were both increased in zbtb14-deficient larvae at 2 and 3 dpf. (R) Statistical results for N–Q’ (Student’s t test, N=3, 15–22 larvae were used for each experiment. Each dot represents the mean value of one experiment. Error bars represent mean ± SEM. ***p<0.001, ****p<0.0001). (S–T’) Representative scatterplot generated by FACS analysis of WKM samples collected from WT Tg(mpeg1.1:eGFP) (up panel) and zbtb14-/-//Tg(mpeg1.1:eGFP) (bottom panel) zebrafish lines in 4-month-old adults. M: myeloid gate. (U) Statistical results for S–T’ in WT Tg(mpeg1.1:eGFP) and zbtb14-/-//Tg(mpeg1.1:eGFP) zebrafish. (Student’s t test, N=4, each time one male and one female were used in the WT and mutant groups. Error bars represent mean ± SEM. **p<0.01).
|
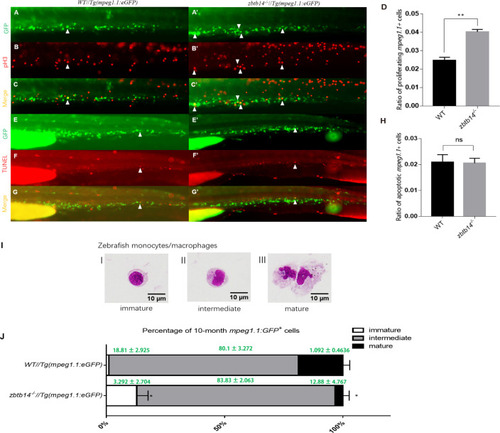
(A–C’, E–G’) pH3 and transferase dUTP nick end labeling (TUNEL) assays in zbtb14-/-//Tg(mpeg1.1:eGFP) and Tg(mpeg1:EGFP) control larvae. Triangles indicate positive signals. (D, H) Statistical result for A–C’ and E–G’. Data shown are the means ± standard error of the mean (SEM) of at least 15 larvae. ns: not statistically significant, **p<0.01. (I) Classification of zebrafish monocytes/macrophages is based on their morphology. (J) Quantification of mpeg1.1 + cells at each differentiation stage. Sorted macrophage lineage cells from 10-month-old zbtb14-/-//Tg(mpeg1.1:eGFP) and Tg(mpeg1.1:eGFP) larvae were subjected to May-Grünwald-Giemsa staining and separated into immature, intermediate, and mature groups according to their morphology. Scale bar: 10 µm. Error bars represent mean ± SEM of three independent experiments. *p<0.05 (Student’s t-test).
|
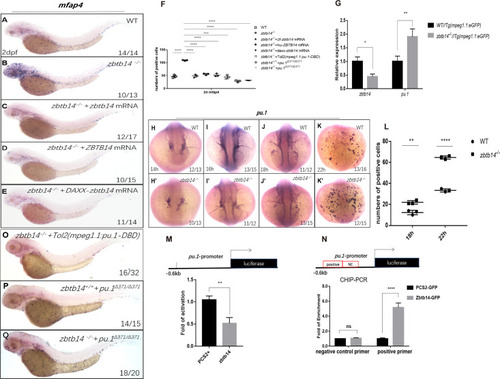
(A–E) mRNA rescue assays in zbtb14-/- larvae. mfap4 probe was used in whole-mount in situ hybridization (WISH) to examine rescue effect with wild zbtb14 (C), ZBTB14 (D), DAXX-ZBTB14 (E) mRNA injections. (F) Statistical result for A–E and O–Q. The statistical significance was calculated by using one-way analysis of variance (ANOVA). The statistical significance was calculated using one-way ANOVA followed by Dunnett T3 correction. The asterisk indicates a statistical difference. (N=3, 10–32 larvae were used for each experiment. Each dot represents the mean value of one experiment. Error bars represent mean ± standard error of the mean (SEM). ****p<0.0001.) (G) Quantitative reverse transcriptase polymerase chain reaction analysis of zbtb14 and pu.1 in GFP positive cells enriched from Tg(mpeg1.1:eGFP) and zbtb14-/-//Tg(mpx:eGFP) larvae at 2 days post-fertilization (dpf). To determine the relative expression rate, data were normalized to the expression level of wild type (WT) groups (which were set to 1.0) after normalized to the internal control of β-actin (Student’s t test, N=3. Error bars represent mean ± SEM. *p<0.05, **p<0.01). (H–K’) Serial WISH analyses of pu.1 in WT and zbtb14-/- embryos. (L) Statistical results for H–K’ (Student’s t test, N=3, 10–16 embryos were used. Each dot represents the mean value of one experiment, which was obtained from the counts of all of the embryos in the same group. Error bars represent mean ± SEM. **p<0.01, ****p<0.0001). (M) Luciferase reporter assay of Zbtb14 on the pu.1 promoter. Bars showed the relative luciferase activity on the zebrafish pu.1 promoter (–0.6 kb). (Student’s t test, N=3. Error bars represent mean ± SEM. **p<0.01.) (N) Chromatin immunoprecipitation polymerase chain reaction (ChIP-PCR) analysis of pu.1 promoter in zebrafish larvae expressing GFP or Zbtb14-GFP using an anti-GFP antibody. Positive: the location of the positive primers. NC: the location of the negative control primers. The statistical significance was calculated by using one-way ANOVA. The asterisk indicates a statistical difference. (N=3. Error bars represent mean ± SEM. ns: not statistically significant, ****p<0.0001.) (O–Q) WISH assay of mfap4 in zbtb14-/- mutants injected with TOL2 mpeg1.1:Pu.1 DBD, pu.1Δ371/Δ371 mutants, and zbtb14-/-//pu.1Δ371/Δ371 double mutants.
|
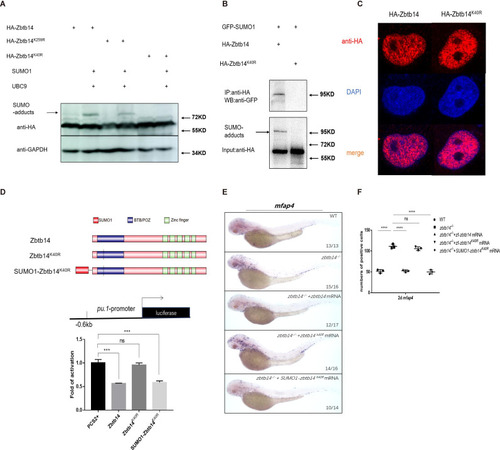
(A) Western blot analysis (anti-HA) of HA-tagged wild type (WT), Zbtb14K40R, and Zbtb14K259R mutant proteins expressed in HEK293T cells in the absence or presence with the SUMO (Small Ubiquitin-like MOdifier) conjugating enzyme UBC9 and SUMO1. (B) HA-tagged WT or Zbtb14K40R mutant protein was immunoprecipitated with an anti-HA antibody from HEK293T cells co-expressing GFP-SUMO1, and SUMOylated Zbtb14 protein was detected by western blot with an anti-GFP antibody. (C) Immunofluorescence analysis of WT (left panel) and Zbtb14K40R mutant protein (right panel). (D) The structure of variant forms of Zbtb14, including WT, Zbtb14K40R, and SUMO1-Zbtb14K40R mutants (top panel). Repression of luciferase expression from the zebrafish pu.1 promoter (–0.6 kb) by Zbtb14 mutants (bottom panel). Bars showed the relative luciferase activity on the zebrafish pu.1 promoter (–0.6 kb). (Student’s t test, N=3. Error bars represent mean ± standard error of the mean (SEM). ns: not statistically significant, ***p<0.001.) (E) mRNA rescue assays in zbtb14-/- mutant larvae. mfap4 probe was used in whole-mount in situ hybridization (WISH) to examine rescue effects of injections of zbtb14, zbtb14K40R, and SUMO1-zbtb14K40R mRNA. (F) Statistical result for E. The statistical significance was calculated by using one-way analysis of variance (ANOVA). The asterisk indicates a statistical difference. (N=3, 10–17 embryos were used for each experiment. Each dot represents the mean value of one experiment. Error bars represent mean ± SEM. ns: not statistically significant, ****p<0.0001.)
|
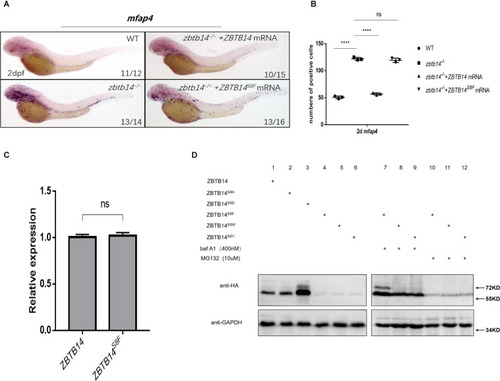
(A) mRNA rescue assays in zbtb14-/- mutant larvae. mfap4 probe was used in whole-mount in situ hybridization (WISH) to examine rescue effects of injections of ZBTB14 and ZBTB14S8F mRNA. (B) Statistical result for A. The statistical significance was calculated by using one-way analysis of variance (ANOVA). The asterisk indicates a statistical difference. (N=3, 10–16 embryos were used for each experiment. Each dot represents the mean value of one experiment. Error bars represent mean ± standard error of the mean (SEM). ns: not statistically significant, ****p<0.0001.) (C) Quantitative reverse transcriptase polymerase chain reaction analysis of ZBTB14 and ZBTB14S8F transfected in HEK293T cells. To determine the relative expression rate, data were normalized to the expression level of wild type (WT) groups (which were set to 1.0) after normalized to the internal control of β-actin. (Student’s t test, N=3. Error bars represent mean ± SEM. ns: not statistically significant.) (D) Western blot analysis (anti-HA) of HA-tagged WT, ZBTB14S8A, ZBTB14S8D, ZBTB14S8F, ZBTB14S8W, and ZBTB14S8Y mutant proteins expressed in HEK293T cells in the absence or presence with baf A1 or MG132. GAPDH served as internal control.
|