FIGURE SUMMARY
Title

Tibetan medicine salidroside improves host anti-mycobacterial response by boosting inflammatory cytokine production in zebrafish

Authors
He, S., Fan, H., Sun, B., Yang, M., Liu, H., Yang, J., Liu, J., Luo, S., Chen, Z., Zhou, J., Xia, L., Zhang, S., Yan, B.
Source
Full text @ Front Pharmacol

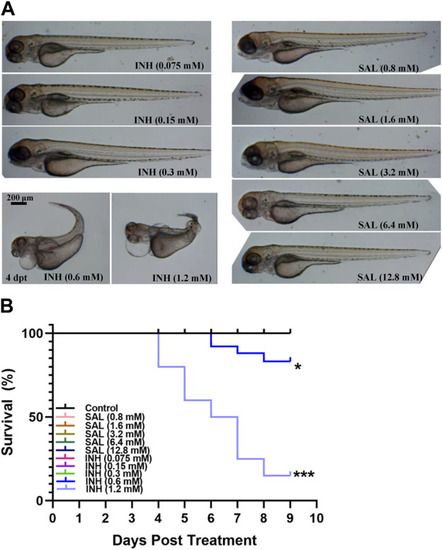
SAL has no obvious teratogenic effect on the growth and development of zebrafish. (A) Representative photos for zebrafish embryos exposed to different concentrations of INH and SAL (4 dpt). (B) Mortality rates of zebrafish embryos exposed to different concentrations of INH and SAL from 0 to 8 dpf. A and B; n = 20 per group. This is one representative data from three independent repeats.

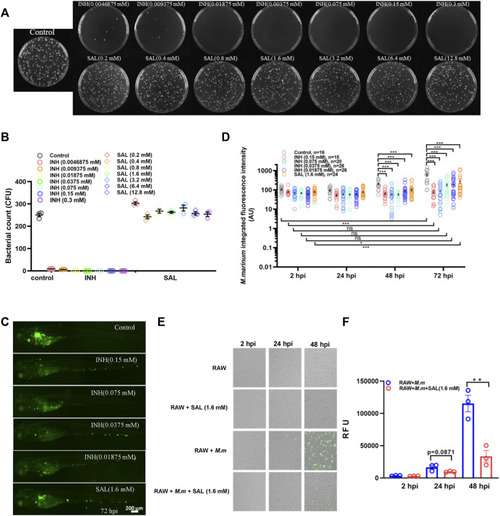
SAL has bacteriostatic activity in vivo but not in vitro. (A) Images showing the growth of M. marinum on 7H10 plates containing different concentrations of INH and SAL after 8 days incubation. (B) Statistics of the colony number in (A). (C) Representative images for the distribution of M. marinum (Wasabi) in different groups of zebrafish at 72 hpi. Scale bar: 200 μm. (D) Statistics of integrated green fluorescence intensity in (C). Values are shown as mean ± s.e.m. One-way ANOVA for comparison at the same time point. Two-way ANOVA for co-operation at different time points. (E)M. marinum-Wasabi-infected RAW cells with or without SAL treatment. (F) Statistics of relative fluorescence units (RFU) of total (extracellular and intracellular) bacteria in (E). A and B are one representative data from three independent repeats. C and D are one representative data from two independent repeats. E and F are one representative data from three independent repeats.

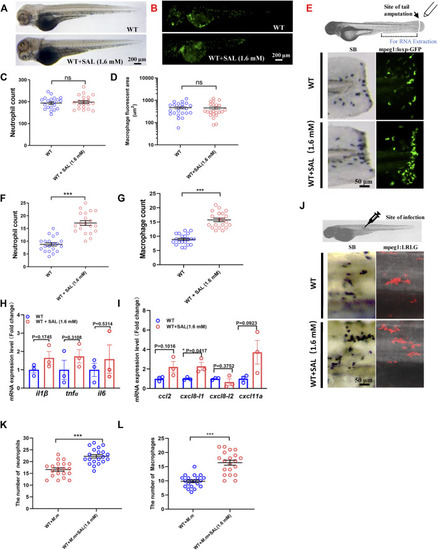
SAL promotes the recruitment of innate immune cells to the wound and infection sites. (A) Images of whole body SB staining of 3-dpf embryos. (B) Fluorescent images of 3-dpf Tg (mpeg1:loxP-GFP) embryos. A and B Scale bar: 200 μm. (C) Statistics of the number of SB+ neutrophils in A. (D) Quantification of total macrophage fluorescent area in B. (E) Schematic view of tail amputation experiment and the tissue for RNA extraction (upper panel); the recruitment of SB+ neutrophils to wound (left panel); and the recruitment of mpeg1:loxp:GFP+ macrophages to wound (right panel). Scale bar: 50 μm. (F) Statistics of the number of SB+ neutrophils in E. (G) Statistics of the number of macrophages in E. (H) Expression of various cytokines in the tail region at 2 hpa. (I) Expression of macrophage and neutrophil recruitment-related chemokines in the tail region at 2 hpa. (J) Images of the SB+ neutrophils (left panel) and mpeg1:LRLG+ macrophages (right panel) infiltration to infection sites. Scale bar: 50 μm. (K) Statistics of the number of SB+ neutrophils in J. (L) Statistics of the number of macrophages in J. A–G, J–L: n = 20 per group; H and I: n = 30 per sample. This is one representative data from three independent biological replicates.

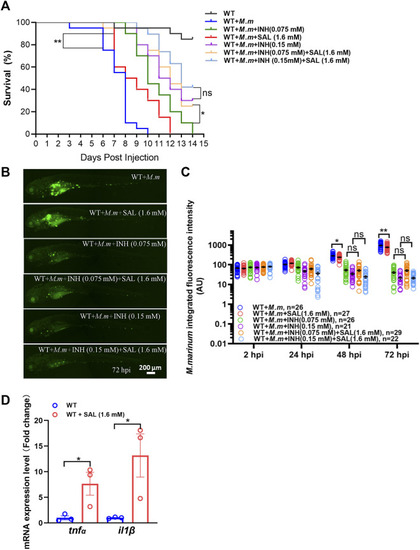
Combined treatment of SAL and INH significantly improve the survival of zebrafish during mycobacterial infection. (A) Survival rates of M. marinum-infected zebrafish embryos treated with various concentrations of INH and SAL. n = 20 per group. (B) Representative images for the distribution of M. marinum (Wasabi) in different groups of zebrafish embryos at 72 hpi. Scale bar: 200 μm. (C) Statistics of integrated green fluorescence intensity in (B). One-way ANOVA was applied for the comparison. (D) Expression of two potent pro-inflammatory cytokines at 12 hpi. n = 30 per sample. A and D: data are representative of three independent biological replicates. B and C data are representative of two independent repeats.

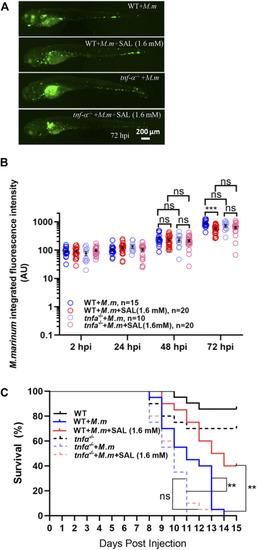
Tnfα is required for SAL-mediated protective effects during mycobacterial infection. (A) Representative images for the distribution of M. marinum (Wasabi) in different groups of zebrafish embryos at 72 hpi. Scale bar: 200 μm. (B) Statistics of normalized green fluorescence intensity in A. One-way ANOVA was applied for the comparison. (C) Survival rates of M. marinum-infected zebrafish tnfα−/− embryos treated with various concentrations of INH and SAL. n = 20 per group. A, B, and C: data are representative of three independent repeats.

Acknowledgments
This image is the copyrighted work of the attributed author or publisher, and ZFIN has permission only to display this image to its users. Additional permissions should be obtained from the applicable author or publisher of the image. Full text @ Front Pharmacol