
- Title
-
Defining the ultrastructure of the hematopoietic stem cell niche by correlative light and electron microscopy
- Authors
- Agarwala, S., Kim, K.Y., Phan, S., Ju, S., Kong, Y.E., Castillon, G.A., Bushong, E.A., Ellisman, M.H., Tamplin, O.J.
- Source
- Full text @ Elife
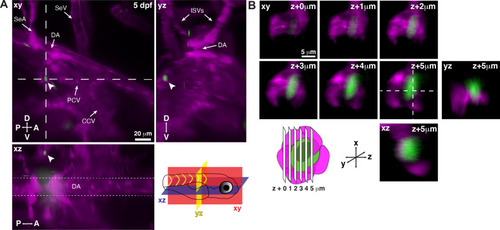
Single hematopoietic stem and progenitor cells (HSPCs) lodge in a perivascular region of the larval kidney niche.
(A) Snapshot of single optical sections (XY, XZ, YZ planes) from light sheet live image of a Runx:GFP;flk:mCherry double transgenic zebrafish larva. A single Runx:GFP+ HSPC (white arrowhead) is lodged in a perivascular region lateral to the dorsal aorta (DA). (B) Detail of optical sections (1 µm steps) through the single lodged Runx:GFP+ HSPC in (A). mCherry+ endothelial cells contact the HSPC and form a surrounding pocket. The +5 µm section is also shown in XZ and YZ planes. Abbreviations: DA, dorsal aorta; SeA, intersegmental artery; SeV, intersegmental vein; PCV, posterior cardinal vein; CCV, common cardinal vein; ISVs, intersegmental vessels; D, dorsal; V, ventral; A, anterior; P, posterior. |
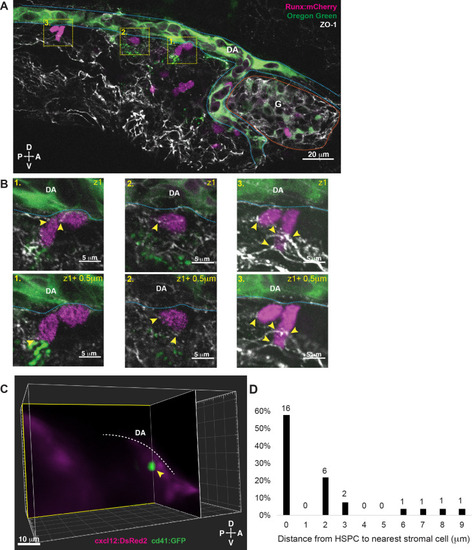
Hematopoietic stem and progenitor cells (HSPCs) lodged in the larval kidney niche make direct contacts with endothelial cells (ECs) and mesenchymal stromal cells (MSCs).
(A) Single optical section from confocal image of larval kidney (fixed) shows Runx:mCherry+ HSPCs (magenta) lodged in the perivascular niche. Oregon Green dye labels the vessel lumen. Blue dotted lines surround the dorsal aorta (DA) and red dotted lines surround the glomerulus (G). Tight junction protein is marked by zonula occludens-1 (ZO-1) (white). (B) High-resolution optical sections (0.5 µm steps) through the boxed regions in (A) show ZO-1+ contact points between mCherry+ HSPCs and the niche (yellow arrowheads). (C) Orthogonal slices (XY and YZ planes) from live light sheet 3D volume of larval kidney niche. Single cd41:GFP+ HSPCs (green) is in contact or in close proximity (yellow arrowhead) to cxcl12:DsRed2+ MSCs (magenta). The white dotted line represents the DA. (D) Quantification of distances measured between GFP+ HSPC and DsRed2+ MSCs shows ~60% of HSPCs are in contact with MSCs, and the remaining are within 9 µm. Numbers above the columns indicate the cell numbers counted in each group (from n=8 embryos). Abbreviations: D, dorsal; V, ventral; A, anterior; P, posterior. |
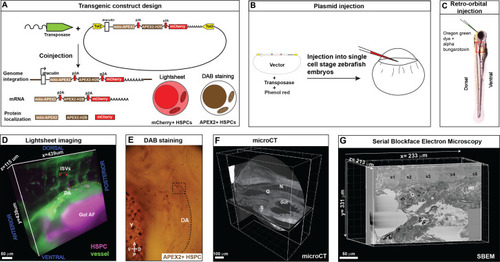
Correlative light and electron microscopy (CLEM) Workflow #1 to genetically encode a label in endogenous hematopoietic stem and progenitor cells (HSPCs) for live tracking by light microscopy and high-contrast resolution in serial block-face scanning electron microscopy (SBEM) sections.
(A) Fusion construct encoding p2A-linked proteins mito-APEX2, APEX2-H2B, and mCherry that localize to the mitochondria, nucleus, and cytoplasm, respectively. The draculin promoter was used to transiently drive strong mosaic expression in HSPCs. Random insertion in the genome was by Tol2-mediated transgenesis. (B) Tol2 draculin:mito-APEX2_p2A_APEX2-H2B_p2A_mCherry (drl:APEX2-mCherry) fusion construct was injected together with tol2 mRNA in one cell wild type zebrafish embryos. (C) At 5 days post fertilization (dpf), embryos with circulating mCherry+ HSPCs were visually screened and retro-orbitally injected with alpha bungarotoxin to paralyze the embryo, and Oregon Green dye to label the vasculature. (D) Dye-injected mCherry+ double positive embryos were visually screened and used for light sheet microscopy (example shows a 439 × 439 × 115 µm3 volume of the anterior kidney marrow (KM); ISVs, intersegmental vessels; yellow dotted line, DA, dorsal aorta; gut AF, gut autofluorescence). (E) Brightfield example of a single embryo after fixation and DAB (3,3'-diaminobenzidine) staining to label APEX2+ HSPCs that are located within the dotted box (dotted line marks DA, dorsal aorta; Y, yolk; D, dorsal; V, ventral; A, anterior; P, posterior). (F) After embedding, the sample was oriented and trimmed based on images acquired using micro-computed tomography (microCT) (example shows orthogonal sections in three planes, N; notochord, G; glomerulus, S; swim bladder). (G) Single plane from ~3000 sections of SBEM data (example shows a 233 × 331 × 213 µm3 volume; s1-s5, somites 1–5; G, glomerulus; PD, pneumatic duct). |
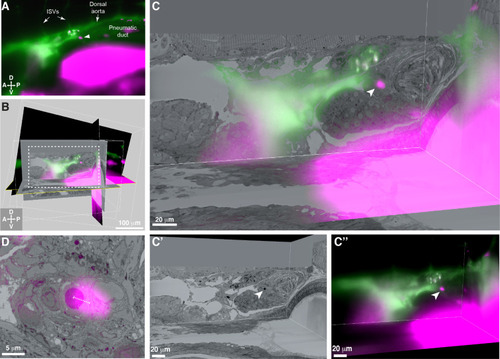
3D alignment of light sheet and serial block-face scanning electron microscopy (SBEM) datasets localizes a single rare hematopoietic stem and progenitor cell (HSPC) across multiple imaging modalities.
(A) Single Z plane from light sheet imaging of drl:APEX2-mCherry+ transgenic larva showing the lodged mCherry+ HSPC (white arrowhead). (B) Global alignment of 3D rendered models generated from light sheet and SBEM datasets using Imaris software. (C) Orthogonal views of the white boxed region within B shows a 3D view of the alignment between light sheet and SBEM datasets. White arrowhead points to the single lodged HSPC in the aligned light sheet and SBEM datasets. (C’) APEX2+ HSPC in SBEM data. (C’’) mCherry+ HSPC in light sheet data. Green: Injected Oregon Green dextran dye marking vessels. Magenta: Runx:mCherry+ HSPCs and autofluorescence in gut. (D) Detail of the alignment shows mCherry+ HSPC and APEX2+ HSPC are <5 µm apart (dotted white line). Abbreviations: ISVs, intersegmental vessels; D, dorsal; V, ventral; A, anterior; P, posterior. |
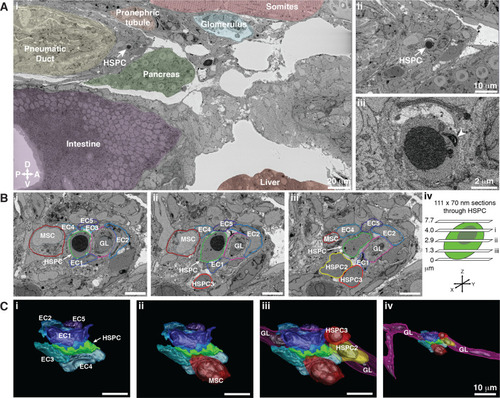
Hematopoietic stem and progenitor cells (HSPCs) lodge in a multicellular niche in the perivascular kidney marrow (KM).
The ultrastructure of a single APEX2+ HSPC (white arrow) and its surrounding niche cells are modeled using 3D SBEM (00:15 from Figure 4—video 1). (A) The APEX2+ HSPC is lodged in the perivascular KM niche. (Ai) Surrounding tissues are labeled; the HSPC is anterior to the pneumatic duct, dorsal to intestine and pancreas, and ventral to the somites and pronephric tubule. (Aii) Higher magnification shows the APEX2+ HSPC is only two-cell diameters from the vessel lumen (white area). (Aiii) Full resolution detail of the APEX2+ HSPC showing high-contrast labeling of the nucleus (APEX2-H2B), mitochondria (mito-APEX2; white arrowhead), and extracellular space dorsal to the cell. (B) (i–iii) SBEM sections at different levels through the APEX2+ HSPC (white arrows) as shown in the schematic (iv). The HSPC is simultaneously in contact with multiple niche cells: five endothelial cells (EC1–5), 1 mesenchymal stromal cell (MSC), and a ganglion-like (GL) cell. Two unlabeled APEX2 negative putative HSPCs were lodged in the same niche (HSPC2 and HSPC3). HSPC2 is attached to HSPC3, and the APEX2+ HSPC (Biii; asterisk). (C) 3D rendered models of the APEX2+ HSPC (solid green) in contact with niche cells. 3D contours are in the same colors as outlines in (B). The APEX2+ HSPC is directly contacted by: (i) five ECs; (ii) one MSC; (iii) one HSPC, and a chain of GL-like cells. (iv) The GL-like cell is part of a long continuous chain of similar cells that extends through the niche. Scale bars: 5 µm unless otherwise labeled. Abbreviations: D, dorsal; V, ventral; A, anterior; P, posterior. |
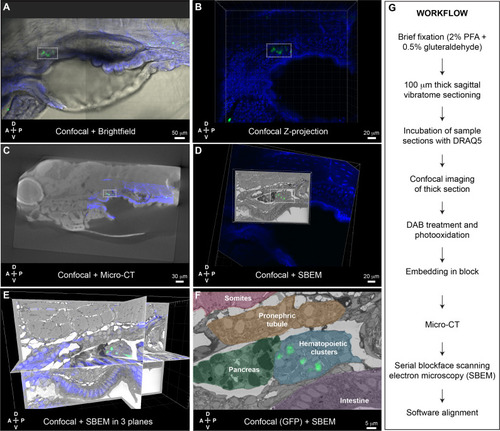
Correlative light and electron microscopy (CLEM) Workflow #2 to align all cd41:GFP+ hematopoietic stem and progenitor cells (HSPCs) in the larval kidney marrow (KM) niche.
Five days post fertilization (dpf) cd41:GFP+ HSPCs (green) and DRAQ5 nuclear dye (blue). (A-D) The same region of the KM niche is marked by a white dotted rectangle. (A) Confocal and brightfield image of thick vibratome section. (B) Confocal Z projection of thick vibratome section. (C) Aligned overlay of micro-computed tomography (microCT) and confocal data. (D) Aligned overlay of serial block-face scanning electron microscopy (SBEM) and confocal data (XY plane only). (E) Aligned overlay of SBEM and confocal data (XY, XZ, YZ planes). (F) Detail of single SBEM section with aligned overlay of cd41:GFP+ HSPCs. Anatomical features are labeled and color-coded. (G) Summary of processing steps used in Workflow #2. Abbreviations: D, dorsal; V, ventral; A, anterior; P, posterior. |
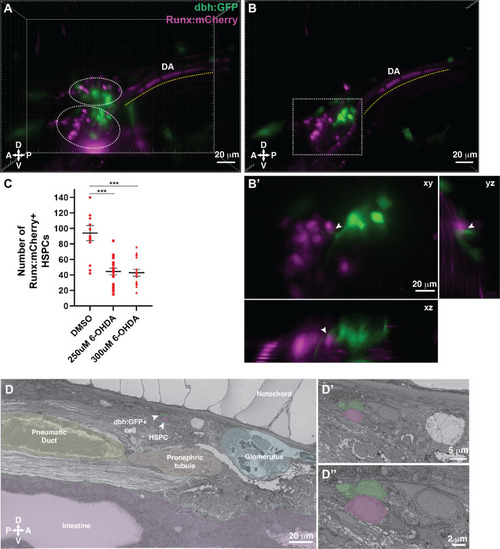
Dopamine beta-hydroxylase positive ganglion-like cells are present within the larval kidney marrow niche.
(A) 3D rendering generated using light sheet movies of Runx:mCherry;dbh:GFP double transgenic larva shows mCherry+ clusters (dotted ovals) in close proximity to GFP+ cells. DA, dorsal aorta. (B) Oblique slice through the 3D volume shows GFP+ extensions from the dbh:GFP+ cells into the mCherry+ hematopoietic stem and progenitor cell (HSPC) clusters. (B’) Detail of the boxed region in B shows contact formation between the GFP+ extensions and mCherry+ HSPCs (white arrowheads) in all three planes. (C) Quantification showing significantly reduced number of Runx:mCherry+ HSPCs in 6-hydroxydopamine (6-OHDA)-treated transgenic larvae compared to DMSO controls. Unpaired t test with Welch’s correction. DMSO vs. 250 μM 6-OHDA, p=0.0003; DMSO vs. 300 μM 6-OHDA, p=0.0002. Sample size (n), DMSO, n=13; 250 μM 6-OHDA, n=18; 300 μM 6-OHDA, n=15. Number of biological replicates = 3. (D) The ultrastructure of a dbh:GFP+ cell (labeled green) in proximity of a cell with HSPC-like morphology (labeled magenta) (white arrowheads). Surrounding tissues are labeled, and the dbh:GFP+ cell HSPC pair is posterior to the glomerulus, dorsal to pneumatic duct, pronephric tubule and intestine, and ventral to the notochord. (D’) Higher magnification shows the dbh:GFP+ cell-HSPC pair is only three-cell diameters from the vessel lumen (white area). (D’’) Full resolution detail of the dbh:GFP+ cell-HSPC pair showing contact formation. Abbreviations: D, dorsal; V, ventral; A, anterior; P, posterior. |