
- Title
-
Calcium sparks enhance the tissue fluidity within epithelial layers and promote apical extrusion of transformed cells
- Authors
- Kuromiya, K., Aoki, K., Ishibashi, K., Yotabun, M., Sekai, M., Tanimura, N., Iijima, S., Ishikawa, S., Kamasaki, T., Akieda, Y., Ishitani, T., Hayashi, T., Toda, S., Yokoyama, K., Lee, C.G., Usami, I., Inoue, H., Takigawa, I., Gauquelin, E., Sugimura, K., Hino, N., Fujita, Y.
- Source
- Full text @ Cell Rep.

Figure 1. Phosphorylation of AHNAK2 is up-regulated in normal cells mix cultured with RasV12-transformed cells (A and B) Phosphorylation of AHNAK2 in monoculture or mix culture of normal and RasV12-transformed cells. (A) Immunofluorescence images of p-AHNAK2. (B) Quantification of fluorescence intensity of p-AHNAK2; “direct” or “second” indicates cells directly contacting or in the second row. Values are expressed as a ratio relative to the average of MDCK alone. Cumulative data from 3 independent experiments are shown as means ± SDs. ∗∗∗∗p < 0.0001 and NS, not significant (1-way ANOVA with Tukey’s test); n = 150, 150, 355, 127, 150, and 67 cells. (C and D) The level of AHNAK2 proteins in monoculture of normal cells or mix culture of normal and RasV12-transformed cells. (C) Immunofluorescence images of AHNAK2. (D) Quantification of fluorescence intensity of AHNAK2. Values are expressed as a ratio relative to the average of MDCK alone. Cumulative data from 3 independent experiments are shown as means ± SDs. NS, not significant (unpaired 2-tailed Student’s t test); n = 50 cells for each experiment. (E–H) Effect of the pan-PKC inhibitor BIM-I or the Ca2+-dependent conventional PKC inhibitor Go6976 on the phosphorylation of AHNAK2 (E and F) or the PKC substrate (G and H). (E and G) Immunofluorescence images of p-AHNAK2 (E) or p-PKC substrate (G) in the absence or presence of BIM-I or Go6976. (F and H) Quantification of the fluorescence intensity of p-AHNAK2 (F) or p-PKC substrate (H). Values are expressed as a ratio relative to the average of MDCK alone (DMSO). (F) Data are means ± SDs from 3 independent experiments. (H) Cumulative data from 3 independent experiments are shown as means ± SDs. ∗∗∗∗p < 0.0001 (1-way ANOVA with Dunnett’s test); n = 50 cells for each experiment. (A, C, E, and G) Scale bars, 20 μm. See also Figures S1, S2, and Table S1. |
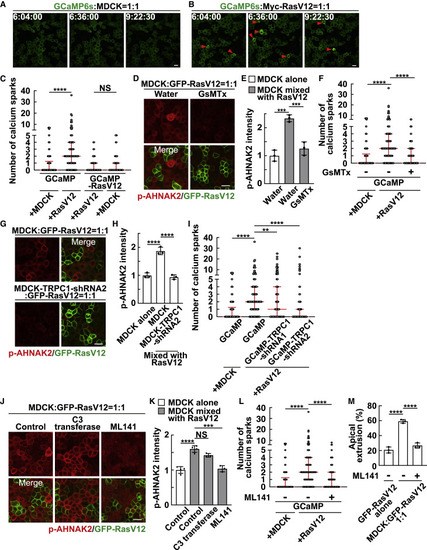
Figure 2. Calcium sparks are induced in normal cells mix cultured with RasV12 cells via the mechanosensitive calcium channel TRPC1 (A and B) Time-lapse analysis of calcium sparks in GCaMP-expressing normal cells mix cultured with normal cells (A) or RasV12-transformed cells (B). Representative images extracted from time-lapse imaging of MDCK-GCaMP6s cells mix cultured with normal MDCK cells (A) or MDCK-pTRE3G Myc-RasV12 cells (B) at a ratio of 1:1 during 6–10 h after the induction of RasV12 expression. The red arrowheads indicate calcium spark-positive cells. (C) Quantification of the number of calcium sparks in MDCK-GCaMP6s cells or MDCK-pTRE3G Myc-RasV12-GCaMP6s cells mix cultured with normal MDCK or MDCK-pTRE3G Myc-RasV12 cells at a ratio of 1:1 during 6–10 h after the induction of RasV12 expression. Cumulative data from 3 (GCaMP) or 2 (GCaMP-RasV12) independent experiments are shown as medians ± IQRs (interquartile ranges). ∗∗∗∗p < 0.0001 and NS, not significant (Kruskal-Wallis test with Dunn’s test); n = 30 cells for each experiment. (D and E) Effect of the mechanosensitive calcium channel inhibitor GsMTx on AHNAK2 phosphorylation. (D) Immunofluorescence images of p-AHNAK2 (red) in the absence or presence of GsMTx. (E) Quantification of the fluorescence intensity of p-AHNAK2. Values are expressed as a ratio relative to the average of MDCK alone (water). Data are means ± SDs from 3 independent experiments. ∗∗∗p < 0.001 (1-way ANOVA with Dunnett’s test); n = 50 cells for each experiment. (F) Effect of GsMTx on the frequency of calcium sparks. Cumulative data from 3 independent experiments are shown as medians ± IQRs. ∗∗∗∗p < 0.0001 (Kruskal-Wallis test with Dunn’s test); n = 30 cells for each experiment. (G and H) Effect of TRPC1-knockdown on AHNAK2 phosphorylation. (G) Immunofluorescence images of p-AHNAK2 (red). (H) Quantification of the fluorescence intensity of p-AHNAK2. Values are expressed as a ratio relative to the average of MDCK alone. Data are means ± SDs from 3 independent experiments. ∗∗∗∗p < 0.0001 (1-way ANOVA with Dunnett’s test); n = 50 cells for each experiment. (I) Effect of TRPC1-knockdown on the frequency of calcium sparks. MDCK-GCaMP6s-TRPC1-shRNA1 or -shRNA2 cells were mix cultured with MDCK-pTRE3G Myc-RasV12 cells at a ratio of 1:1. Cumulative data from 4 (GCaMP-TRPC1-shRNA1) or 3 (the other conditions) independent experiments are shown as medians ± IQRs. ∗∗p < 0.01 and ∗∗∗∗p < 0.0001 (Kruskal-Wallis test with Dunn’s test); n = 30 cells for each experiment. (J and K) Effect of the Rho inhibitor C3 transferase or the Cdc42 inhibitor ML141 on AHNAK2 phosphorylation. (J) Immunofluorescence images of p-AHNAK2 (red) in the absence or presence of C3 transferase or ML141. (K) Quantification of the fluorescence intensity of p-AHNAK2. Values are expressed as a ratio relative to the average of MDCK alone (control). Data are means ± SDs from 4 (control) or 3 (C3 transferase and ML141) independent experiments. ∗∗∗p < 0.001, ∗∗∗∗p < 0.0001, and NS, not significant (1-way ANOVA with Dunnett’s test); n = 50 cells for each experiment. (L) Effect of ML141 on the frequency of calcium sparks. Cumulative data from 3 independent experiments are shown as medians ± IQRs. ∗∗∗∗p < 0.0001 (Kruskal-Wallis test with Dunn’s test); n = 30 cells for each experimental condition. (M) Effect of ML141 on apical extrusion of RasV12-transformed cells. At 24 h after RasV12 induction, the ratio of the apical extrusion was analyzed. Data are means ± SDs from 3 independent experiments. ∗∗∗∗p < 0.0001 (1-way ANOVA with Dunnett’s test); n > 250 cells for each experiment. (A, B, D, G, and J) Scale bars, 20 μm. See also Figure S3; Videos S1, S2, and S3. |
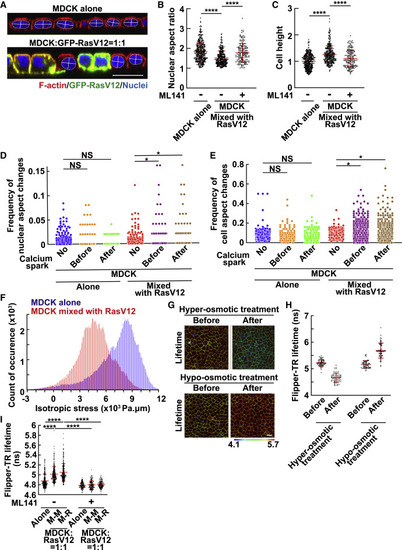
Figure 3. Mix culture with RasV12-transformed cells induces morphological and mechanical changes in normal cells in a non-cell-autonomous manner (A–C) The nuclear aspect ratio or cell height in normal cells mix cultured with RasV12-transformed cells. (A) The xz-immunofluorescence images of normal cells mix cultured with RasV12 cells. Normal MDCK cells were cultured alone or mix cultured with MDCK-pTR GFP-RasV12 cells at a ratio of 1:1, followed by staining with Alexa Fluor-568-phalloidin (red) and Hoechst (blue). The lines indicate the major and minor axes of the nucleus. (B and C) The nuclear aspect ratio (major axis/minor axis) (B) or cell height (C) in the absence or presence of ML141 was quantified from xz-confocal images. For cell height, values are expressed as a ratio relative to the average of MDCK alone. Cumulative data from 5 (absence of ML141) or 3 (presence of ML141) independent experiments are shown as means ± SDs. ∗∗∗∗p < 0.0001 (1-way ANOVA with Dunnett’s test); n = 355, 306, and 162 cells. (D and E) Frequency of changes in the nuclear aspect ratio (D) or cell aspect ratio (E). MDCK-GCaMP6s cells were mix cultured with normal MDCK (MDCK alone) or MDCK-pTRE3G Myc-RasV12 cells (MDCK mixed with RasV12). Cells were stained with Hoechst and the far-red silicon rhodamine (SiR)-actin fluorescent probe, followed by time-lapse imaging with 30-s intervals during 6–10 h after the induction of RasV12 expression. The dynamic changes in the nuclear or cell aspect ratio before and after calcium sparks were analyzed. The triangle threshold algorithm was applied to obtain the threshold for morphological change points (for details, see STAR Methods). The values are expressed as a frequency of significant changes within each 30-s interval. Cumulative data from 2 independent experiments are shown. ∗p < 0.05 and NS, not significant (Wilcoxon signed sum test with Bonferroni correction). n = 414, 117, 117, 301, 283, and 283 cells. (F) Isotropic stress in normal cells mix cultured with RasV12-transformed cells. MDCK-GCaMP6s cells were mix cultured with MDCK cells or MDCK-pTRE3G Myc-RasV12 at a ratio of 1:1 on a soft silicone elastomer substrate coated with fluorescent beads, which allowed us to measure the traction forces exerted by the cells on the underlying substrate using traction force microscopy (TFM). The traction forces were converted to intracellular stress inside the monolayer using Bayesian inversion stress microscopy (BISM). The isotropic stress in the monolayers at 6–10 h after the induction of RasV12 expression was calculated. The representative histograms are shown from 2 independent experiments. Binning of the histogram is presented every 100 Pa.μm, and the y axis indicates the count of occurrence in each bin. (G and H) Effect of hyper- or hypo-osmotic treatment on the fluorescence lifetime of Flipper-TR. Normal MDCK cells were stained with the Flipper-TR membrane tension probe. The fluorescence lifetime of Flipper-TR was measured using fluorescence lifetime imaging microscopy (FLIM) before and after hyper-osmotic treatment for 20 min or hypo-osmotic treatment for 10 min. (G) Representative FLIM images of MDCK cells before and after hyper- or hypo-osmotic treatment. The color bar corresponds to lifetime (nanoseconds). (H) Quantification of Flipper-TR lifetime at cell-cell adhesions. Data are means ± SDs from 60 regions for each experiment. (I) Effect of mix culture with RasV12-transformed cells on Flipper-TR lifetime. Flipper-TR lifetime at cell-cell adhesions between MDCK cells (M-M) or between MDCK and RasV12 cells (M-R) was analyzed. Cumulative data from 4 (absence of ML141) or 2 (presence of ML141) independent experiments are shown as means ± SDs. ∗∗∗∗p < 0.0001 (1-way ANOVA with Tukey’s test); n = 60 regions for each experiment. (A and G) Scale bar, 20 μm. See also Figure S4. |
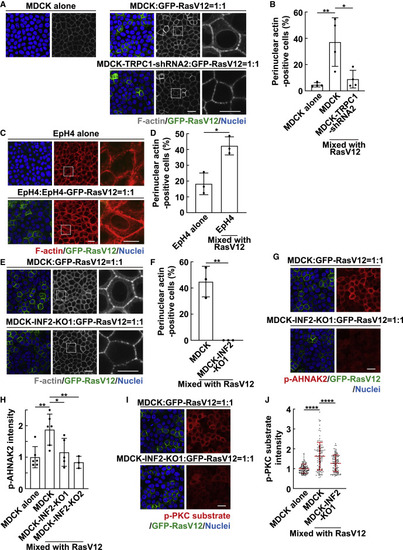
Figure 4. INF2 induces perinuclear actin and AHNAK2 phosphorylation (A and B) TRPC1-mediated perinuclear actin in normal cells mix cultured with RasV12-transformed cells. (A) Fluorescence images of perinuclear actin. Magnified images of the white dashed regions are shown at right. (B) Quantification of perinuclear actin-positive cells. Data are means ± SDs from 4 independent experiments. ∗p < 0.05 and ∗∗p < 0.01 (1-way ANOVA with Dunnett’s test); n = 1,009, 672, and 719 cells. (C and D) Perinuclear actin in EpH4 cells. (C) Fluorescence images of perinuclear actin. Magnified images of the white dashed regions are shown at right. (D) Quantification of perinuclear actin-positive cells. Data are means ± SDs from 3 independent experiments. ∗p < 0.05 (unpaired 2-tailed Student’s t test); n = 885 and 488 cells. (E and F) Effect of INF2-knockout (KO) on perinuclear actin. (E) Fluorescence images of perinuclear actin. Magnified images of the white dashed regions are shown at right. (F) Quantification of perinuclear actin-positive cells. Data are means ± SDs from 3 independent experiments. ∗∗p < 0.01 (unpaired 2-tailed Student’s t test); n = 383 and 348 cells. (G and H) Effect of INF2-KO on AHNAK2 phosphorylation. (G) Immunofluorescence images of p-AHNAK2. (H) Quantification of the immunofluorescence intensity of p-AHNAK2. Values are expressed as a ratio relative to the average of MDCK alone. Data are means ± SDs from 6 (MDCK alone and MDCK mixed with RasV12), 5 (MDCK-INF2-KO1 mixed with RasV12), or 3 (MDCK-INF2-KO2 mixed with RasV12) independent experiments. ∗p < 0.05 and ∗∗p < 0.01 (1-way ANOVA with Dunnett’s test); n = 215, 215, 185, and 85 cells. (I and J) Effect of INF2-KO on p-PKC substrate. (I) Immunofluorescence images of p-PKC substrate. (J) Quantification of the immunofluorescence intensity of p-PKC substrate. Values are expressed as a ratio relative to the average of MDCK alone. Cumulative data from 3 independent experiments are shown as means ± SDs. ∗∗∗∗p < 0.0001 (1-way ANOVA with Dunnett’s test); n = 110 cells for each experimental condition. (A, C, E, G, and I) Scale bars, 20 and 10 μm (magnified images). See also Figure S4. |
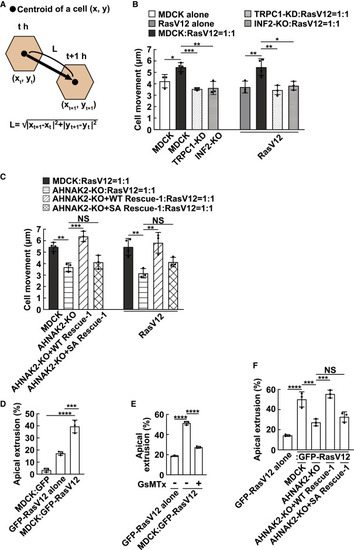
Figure 5. Calcium sparks promote the epithelial tissue fluidity at the early phase of cell competition through the INF2-AHNAK2 pathway (A) The schematic diagram for the displacement of the centroid of a cell. Black dots indicate the centroid of a cell (x, y). Using time-lapse imaging, cell movement was analyzed by calculating the displacement from the centroid of the cells at t h (xt, yt) to that at t + 1 h (xt + 1, yt + 1): the length of the black arrow (“L”). (B) Effect of TRPC1-knockdown or INF2-KO on cell movement. The total cell movement at 6–10 h after RasV12 induction was analyzed. Data are means ± SDs from 4 (MDCK:RasV12 = 1:1) or 3 (the other conditions) independent experiments. ∗p < 0.05, ∗∗p < 0.01, and ∗∗∗p < 0.001 (1-way ANOVA with Dunnett’s test); n = 30 cells for each experiment. (C) Effect of the rescue of the expression of AHNAK2-WT (wild-type) or -SA (non-phosphorylatable form) into AHNAK2-KO cells on cell movement. Data are means ± SDs from 4 (MDCK:RasV12 = 1:1) or 3 (the other conditions) independent experiments. ∗∗p < 0.01, ∗∗∗p < 0.001, and NS, not significant (1-way ANOVA with Dunnett’s test); n = 30 cells for each experiment. (D) Quantification of apical extrusion of RasV12-transformed cells mix cultured with normal cells. At 24 h after GFP or GFP-RasV12 induction, the ratio of apical extrusion was analyzed. Data are means ± SDs from 3 independent experiments. ∗∗∗p < 0.001 and ∗∗∗∗p < 0.0001 (1-way ANOVA with Dunnett’s test); n > 250 cells for each experiment. (E) Effect of the mechanosensitive calcium channel inhibitor GsMTx on apical extrusion of RasV12-transformed cells. Cells were cultured in the presence of GsMTx for 16 h after RasV12 induction, followed by the washout of GsMTx. At 24 h after RasV12 induction, the ratio of apical extrusion was analyzed. Data are means ± SDs from 3 independent experiments. ∗∗∗∗p < 0.0001 (1-way ANOVA with Dunnett’s test); n > 250 cells for each experiment. (F) Effect of the rescue of AHNAK2-WT or -SA expression into AHNAK2-KO cells on apical extrusion. At 24 h after RasV12 induction, the ratio of apical extrusion was analyzed. Data are means ± SDs from 3 independent experiments. ∗∗∗p < 0.001, ∗∗∗∗p < 0.0001, and NS, not significant (1-way ANOVA with Tukey’s test); n > 250 cells for each experiment. See also Figure S5. |
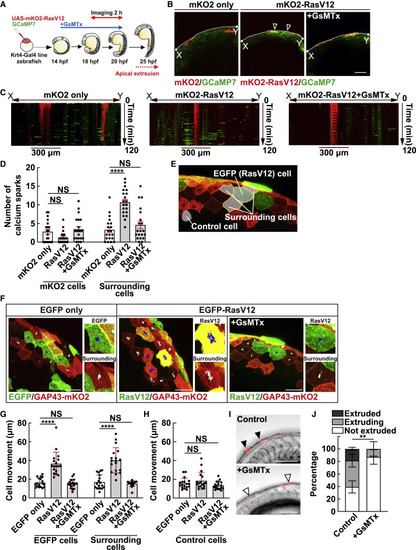
Figure 6. Mechanosensitive calcium channel positively regulates calcium sparks, cell movement, and apical extrusion in zebrafish larvae (A) Schematic illustration of the experimental time course to observe calcium sparks before apical extrusion in zebrafish. (B–D) Mechanosensitive calcium channel-mediated calcium sparks around RasV12-expressing cells in zebrafish larvae. (B) Fluorescence images of zebrafish 18-somite larvae expressing mKO2-RasV12 and GCaMP7 in the absence or presence of GsMTx. The result shown is the representative from 10 independent experiments. The arrowheads indicate calcium spark-positive cells. (C) Kymographs showing the calcium sparks (green) around RasV12-expressing cells (red). The area used for analysis (X-Y in B) is shown on the horizontal axis, and the time is shown on the vertical axis. (D) Quantification of the frequency of calcium sparks within 300 μm around RasV12-expressing cells or mKO2 only-expressing cells for 2 h in the absence or presence of GsMTx. Individual data points are plotted with the means ± SEMs. ∗∗∗∗p < 0.0001 and NS, not significant (1-way ANOVA with Tukey’s post-hoc multiple comparison test); n = 20 cells for each experimental condition. (E–H) Effect of GsMTx on the cell movement in zebrafish larvae. (E) The cells used for the analysis of cell movement. A fluorescence image of zebrafish 18-somite larvae expressing EGFP-RasV12 and GAP43-mKO2. The white dotted line indicates an EGFP-RasV12 cell, while the yellow dotted line indicates surrounding normal cells expressing GAP43-mKO2. The blue dotted line indicates a cell distant from RasV12-expressing cells, which was used as control. (F) Fluorescence images of zebrafish 18-somite larvae expressing EGFP or EGFP-RasV12 and GAP43-mKO2 in the absence or presence of GsMTx. The trajectory of a cellular centroid shows the sum of the frame-to-frame distances for 2 h (12 frames at 10-min interval). The result shown is the representative from 10 independent experiments. (G) Quantification of the total distance of cell movement for 2 h. The RasV12-expressing cells and surrounding cells (as shown in E and F) were analyzed. Individual data points are plotted with the means ± SDs. ∗∗∗∗p < 0.0001 and NS, not significant (2-way ANOVA with Tukey’s post-hoc multiple comparison test); n = 18 cells for each experimental condition. (H) Quantification of the total distance of cell movement of the control cells for 2 h. The control cells distant from RasV12-expressing cells (as shown in E) were analyzed. Individual data points are plotted with the means ± SDs. NS, not significant (2-way ANOVA with Tukey’s post-hoc multiple comparison test); n = 18 cells for each experimental condition. (I and J) Effect of the mechanosensitive calcium channel inhibitor GsMTx on apical extrusion of RasV12-transformed cells. (I) Fluorescence images of zebrafish larvae (24 hpf) expressing mKO2-RasV12 treated with or without GsMTx for 4 h. Black and white arrowheads indicate apically extruded and not-extruded mKO2-RasV12 cells, respectively. (J) Quantification of apical extrusion of RasV12-expressing cells at 24 hpf. Data are means ± SDs from 5 independent experiments. ∗∗p < 0.01 (2-tailed Student’s t tests). (B, F, and I) Scale bars, 100 μm. See also Video S4. |