
- Title
-
Bacterial Quorum-Sensing Signal DSF Inhibits LPS-Induced Inflammations by Suppressing Toll-like Receptor Signaling and Preventing Lysosome-Mediated Apoptosis in Zebrafish
- Authors
- Zhu, H., Wang, Z., Wang, W., Lu, Y., He, Y.W., Tian, J.
- Source
- Full text @ Int. J. Mol. Sci.
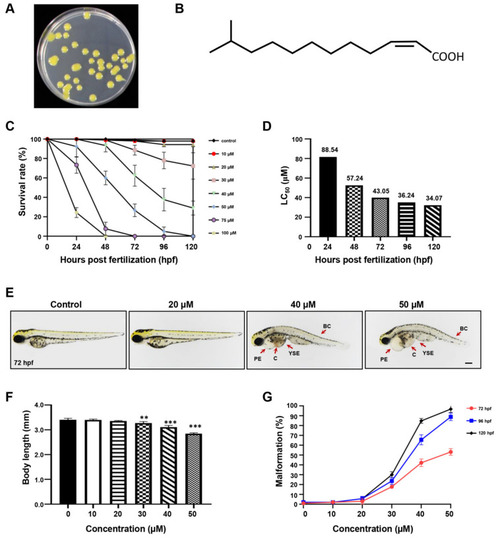
The effect of DSF on zebrafish embryos. (A) DSF producer Xcc. (B) The chemical structure of DSF. (C) The survival rate of embryos treated with different doses of DSF at 24, 48, 72, 96, and 120 hpf. (D) LC50 of DSF-treated embryos. (E) DSF-treated embryos (0, 20, 40, and 50 μM) revealed different malformed phenotypes at 72 hpf. PE, pericardial edema; YSE, yolk sac edema; C, congestion; BC, body curvature. (F) The body length was calculated at 72 hpf after embryos were treated with different doses of DSF. (G) Quantification of the malformation rate at 72, 96, and 120 hpf embryos after treatment with different doses of DSF. The LC50 was calculated with IBM SPSS 22 statistics. The values are represented as mean ± S.D. ** p < 0.01, *** p < 0.001. Scale bar, 200 μm. |

DSF ameliorated intestinal damage of zebrafish embryos after LPS-induced inflammation. (A) The goblet cells in zebrafish intestinal mucosa were stained with alcian blue (red boxes). (B) The intestinal goblet cells (red boxes) in A were enumerated. (C) The histopathological changes in the zebrafish intestine were detected with H&E staining. Data are represented as mean ± S.D. *** p < 0.001 vs. control group; # p < 0.05 vs. LPS group. Scale bar, 100 μm. |
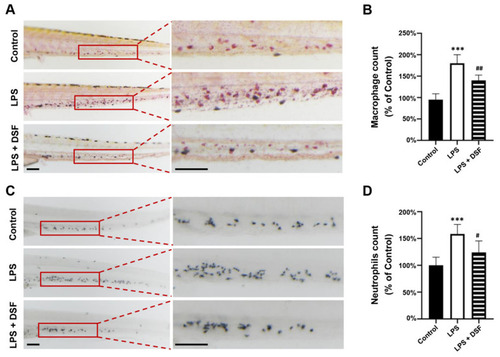
DSF prevented LPS-induced accumulation of macrophages and neutrophils in zebrafish embryos. (A) The macrophages were labeled with Neutral red staining. (B) Quantitative analysis of macrophages in the same area (red boxes) in A. (C) The neutrophils were labeled with Sudan Black B staining. (D) Quantitative analysis of neutrophils in the same area (red boxes) in C. Data are represented as mean ± S.D. *** p < 0.001 vs. control group; # p < 0.05, ## p < 0.01 vs. LPS group. Scale bar, 100 μm. |

DSF inhibited LPS-induced ROS production and inflammation in zebrafish embryos. (A) ROS generation in zebrafish embryos was detected with fluorescent probe DCFH-DA staining. (B) ROS levels were measured by quantification of fluorescence intensity for individual embryos using fluorescence microscopy and ImageJ analysis. (C) The relative mRNA expression levels of inflammatory markers (il1b, il6, il10, and tnfα) were measured with qRT-PCR. Data are represented as mean ± S.D. * p < 0.05, ** p < 0.01, *** p < 0.001 vs. control group; ## p < 0.01, and ### p < 0.001 vs. LPS group. Scale bar, 200 μm. |

DSF reduced LPS-induced apoptosis in zebrafish embryos. (A) The prevalence of apoptosis in zebrafish embryos was detected with fluorescent dye AO staining; red arrows indicate the apoptotic cells. (B) The fluorescence intensity was quantified for individual zebrafish using ImageJ analysis. (C) The relative mRNA expression levels of apoptosis markers (baxa, bcl2, mdm2, and tp53) were measured with qRT-PCR. Data are represented as mean ± S.D. * p < 0.05, ** p < 0.01, *** p < 0.001 vs. control group; ## p < 0.01, and ### p < 0.001 vs. LPS group. Scale bar, 200 μm. |

Transcriptome analysis of differentially expressed genes between LPS and LPS + DSF groups. (A) Heat map representation showing a total of 2029 DGEs in control, LPS- and LPS + DSF-treated zebrafish embryos. (B) Volcano plots show a total of 938 DGEs in LPS and LPS + DSF groups. (C) GO term analysis and (D) KEGG pathway analysis for up-regulating DEGs in LPS + DSF zebrafish embryos compared to the LPS group. (E) GO term analysis and (F) KEGG pathway analysis of down-regulated DEGs in LPS + DSF zebrafish embryos compared to the LPS group. The size of the dot indicates the number of genes enriched in an individual item. The color of the dot represents the p value. |

DSF targeting downstream signaling screening and verification. (A) Toll-like receptor signaling, (B) inflammation cytokines and chemokines, and (C) lysosome-apoptosis-related genes explored with heat map analysis and verified with qRT-PCR (D–F). Data are represented as mean ± S.D. ** p < 0.01, *** p < 0.001 vs. control group; # p < 0.05, ## p < 0.01, and ### p < 0.001 vs. LPS group. |

The hypothesis of the molecular mechanism of DSF in the anti-inflammatory effect. |