
FIGURE SUMMARY
- Title
-
PARD3 gene variation as candidate cause of nonsyndromic cleft palate only
- Authors
- Cui, R., Chen, D., Li, N., Cai, M., Wan, T., Zhang, X., Zhang, M., Du, S., Ou, H., Jiao, J., Jiang, N., Zhao, S., Song, H., Song, X., Ma, D., Zhang, J., Li, S.
- Source
- Full text @ J. Cell. Mol. Med.

PARD3 variant found in a pedigree with NSCP. (A) The pedigree with nonsyndromic cleft palate only. Unfilled and shaded shapes denote healthy and affected individuals, respectively. Squares represent males, and circles represent females. The arrow indicates the proband. (B) Clinical image of two affected individuals (III3 and III6) from the pedigree, which show the cleft of the soft palate. (C) The heterozygous single nucleotide insertion variant in PARD3 was verified by Sanger sequencing. The variant was named according to GenBank: NM_019619.4, NP_062565.2. (D) Protein sequence alignment of PARD3 orthologs was performed by Multiple Sequence Alignment (MUSCLE). The p. E338Gfs*26 variant and the associated new residue sequence are shown above and indicated in red. (E) A schematic diagram of functional domains in the PARD3 (GenBank: NP_062565.2) protein. N= amino terminus; C= carboxy terminus
|
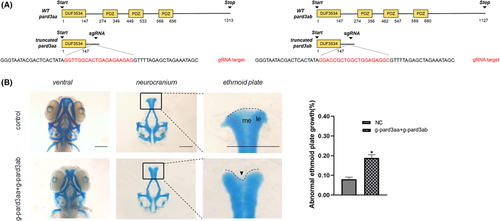
Zebrafish with pard3aa and pard3ab disruption displayed ethmoid plate patterning defects. (A) Schematic diagram of the binding and cleavage site of CRISPR/Cas9 in the coding sequence of the zebrafish PARD3 orthologs (pard3aa, pard3ab). Red = gRNA target. (B) Comparison of craniofacial structures of F0 CRISPR/Cas9-mediated mutant zebrafish and Cas9 control zebrafish. The neurocranium was dissected at 3 dpf. Compared with the larvae in the control group, the CRISPR mutant larvae had a mild dysplasia phenotype, with subtle indentations at the upper edge of the ethmoid plate or hypoplastic at the median ethmoid (arrowheads). me = median ethmoid; le = lateral ethmoid. The statistical analysis of abnormal developmental palate was performed (bars indicate the means ± SEM. Student’s t test, *p < 0.05). Scale bar = 200 μm
PHENOTYPE:
|

Expression of the patient-derived truncated PARD3 (c.1012dupG) variant induced hypoplastic ethmoid plate development in zebrafish. (A) Representative images of the control group and the larvae with patient-derived truncating variant mRNA injection are depicted. Compared with the development of the ethmoid plate in control group larvae, the larvae injected with PARD3-c.1012dupG mRNA showed ethmoid plate dysplasia, with the median ethmoid plate having a certain degree of absence and failing to form a smooth upper edge of the ethmoid plate. Scale bar = 200 μm. (B) Quantification of hypoplastic development of the ethmoid plate between the experimental groups and the control group (bars indicate the means ± SEM. Student’s t test was used to analyse the data. **p < 0.01)
|
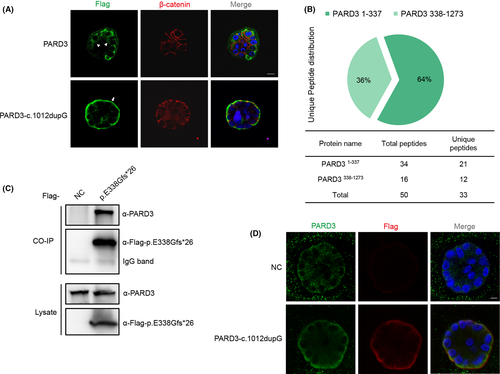
Truncated PARD3-c.1012dupG variant changed the localization of the wild-type full-length PARD3 protein. (A) MCF-10A cells stably expressing Flag-tagged PARD3-c.1012dupG or full-length PARD3 were developed by lentiviral infection and puromycin selection and formed apical lumens after 10 days of 3D culture in Matrigel. The cysts were stained for Flag-tagged PARD3 (wild-type or mutant) (green) and the basolateral membrane marker β-catenin (red). The truncated PARD3(c.1012dupG) was mainly localized to the basal compartment, while the full-length PARD3 was mainly localized to the lateral and apical areas. The arrow points to the presence of truncated PARD3 at the basal region. Arrowheads point to the apical region. Scale bar = 10 μm. (B) Mass spectrometry analysis of PARD3-c.1012dupG products identified endogenous full-length PARD3 as the candidate interacting protein. Plasmids expressing SBP-His8-tagged PARD3-c.1012dupG or empty vector were stably transfected into HEK-293T cells, and the cells were harvested and lysed 72 h after selection with hygromycin B. Peptides derived from the trypsin digestion of mutant PARD3 pull down complex were analysed by LC–MS/MS. Herein, we used PARD3338-1273 to refer to the C-terminal signal of endogenous PARD3 bound by the PARD3-c.1012dupG protein. The number of peptide hits for the C-terminal signal of endogenous PARD3 (PARD3338-1273) is shown as a pie chart and table. (C) Endogenous PARD3 interacted with Flag-tagged PARD3-p. E338Gfs*26. Flag-tagged PARD3-p. E338Gfs*26 was immunoprecipitated from the cell lysate of HEK-293T cells stably expressing Flag-tagged PARD3-p. E338Gfs*26, and the coimmunoprecipitation product was analysed by anti-PARD3 (C-terminal immunogen) and anti-Flag immunoblotting. (D) Substantial proportion of endogenous PARD3 colocalized with Flag-tagged PARD3-c.1012dupG mainly at the basement membrane in 3D-cultured MCF-10A cells. MCF-10A cells stably expressing Flag-tagged PARD3-c.1012dupG or empty vector were grown in Matrigel, and endogenous PARD3 was analysed with immunofluorescent staining using C-terminal PARD3 antibody (green). Mutant PARD3 was visualized by Flag antibody (red), and nuclei were stained with DAPI (blue). Scale bar = 7.5 μm
|
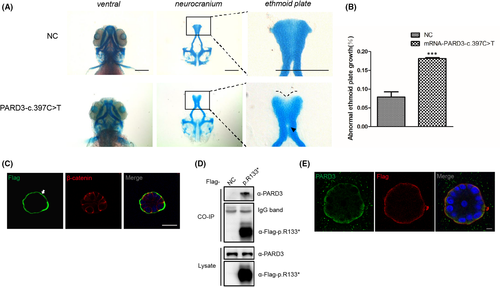
Functional validation of the N-terminal truncating variant c.397C>T identified in a sporadic case with NSCP. (A) Representative images of the control group and zebrafish larvae injected with PARD3-c.397C>T variant mRNA are depicted. Scale bar = 200 μm. (B) Statistical analysis for (A). Bars indicate the means ± SEM. Student’s t test was used to analyse the data. ***p < 0.001. (C) MCF-10A cells stably expressing PARD3-c.397C>T were polarized and formed apical lumens after 10 days of 3D culture in Matrigel. The cysts were stained for Flag-tagged PARD3-c.397C>T (green) and the basolateral membrane marker β-catenin (red). PARD3-c.397C>T localized to the basal compartment rather than the apical region. The arrowhead points to the presence of truncated PARD3 at the basal region. The asterisk indicates the apical area. Scale bar = 25 μm. (D) Endogenous PARD3 interacted with Flag-tagged PARD3-p.R133*. Flag-tagged PARD3-p. R133* was immunoprecipitated from cell lysates of HEK-293T cells stably expressing Flag-tagged PARD3-p. R133*, and the coimmunoprecipitation product was analysed by anti-PARD3 (C-terminal immunogen) and anti-Flag immunoblotting. (E) 3D culture of MCF-10A cells was performed, and MCF-10A cells stably expressing Flag-tagged PARD3-c. 397C>T showed that a substantial proportion of endogenous PARD3 colocalized with PARD3-c.397C>T, which was mainly at the basement membrane. Endogenous PARD3 was analysed with immunofluorescent staining using a C-terminal PARD3 antibody (green), PARD3-c.397C>T was visualized with a Flag antibody (red), and nuclei were stained with DAPI (blue). Scale bar = 7.5 μm
|
Acknowledgments
This image is the copyrighted work of the attributed author or publisher, and
ZFIN has permission only to display this image to its users.
Additional permissions should be obtained from the applicable author or publisher of the image.
Full text @ J. Cell. Mol. Med.