
- Title
-
SpG and SpRY variants expand the CRISPR toolbox for genome editing in zebrafish
- Authors
- Liang, F., Zhang, Y., Li, L., Yang, Y., Fei, J.F., Liu, Y., Qin, W.
- Source
- Full text @ Nat. Commun.
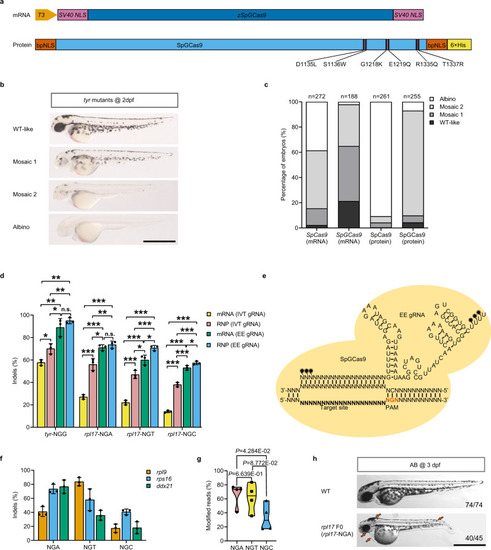
Optimized SpGCas9 showed high editing efficiency at NGN PAM sites in zebrafish.
a Schematic illustration of codon-optimized SpGCas9 mRNA (zSpGCas9) and prokaryotic-expressed SpGCas9 protein. Six specific amino acid mutations (D1135L, S1136W, G1218K, E1219Q, R1335Q, and T1337R) were introduced into the SpCas9 amino acid sequence to obtain SpGCas9. b Biallelic disruption of tyrosinase (tyr) by SpGCas9 generates mosaic pigmentation phenotypes. Lateral views of 2 dpf embryos are shown. The mosaic pigmentation degree (WT-like, mosaic 1, mosaic 2, albino) compared with wild-type (WT) is defined in Supplementary Fig.. Scale bars: 1 mm. This experiment was repeated 3 times independently with similar results. c Phenotype statistics of embryos injected with SpCas9 mRNA/gRNA duplex, SpGCas9 mRNA/gRNA duplex, SpCas9: gRNA RNP complex, and SpGCas9: gRNA RNP complex. The stacked columns indicate the percentages of albino (white), mosaic 2 (light grey), mosaic 1 (medium grey), and WT-like (dark grey) zebrafish related to b. The total number of embryos was shown above each column. d Bar plot of indel efficiency edited by SpGCas9 mRNA/gRNA duplex or SpGCas9: gRNA RNP complex containing IVT gRNAs (in vitro-transcribed gRNA) or EE gRNAs (EasyEdit gRNA) across tyr-NGG, rpl17-NGA, rpl17-NGT and rpl17-NGC PAM sites. Editing efficiency was assessed by targeted Sanger sequencing and ICE analysis (values are presented as mean value ± standard deviation (SD), n = 3 biological replicates). Data were analysed by two-tailed paired t test. *P ≤ 0.05, **P ≤ 0.01, and ***P ≤ 0.001 (n.s. not significant). The exact P values are listed in Supplementary Data 6. e A schematic diagram of the sequence and secondary structure of EE gRNA loaded into SpGCas9 protein and bound to the genomic target site. The chemically modified nucleotides are labelled with black stars. f The editing efficiency of SpGCas9 at 9 targets with NGH PAMs in the genes rpl9, rps16 and ddx21 (values are presented as mean value ± standard deviation (SD), n = 3 biological replicates). g Assessment of the preference of SpGCas9-mediated mutagenesis for the last N of NGN PAMs using the violin plot. Each data point represents the averaged editing activity at the particular site. The centre line shows means of all data points. Two-tailed paired t test were performed (with P values marked). h Lateral views of SpGCas9:rpl17 EE gRNA (targeting NGA PAM) RNP complex induced mutated F0 at 3 dpf. Red arrows indicate the specific features of rpl17 mutants. Scale bar: 1 mm. this experiment was repeated 3 times independently with similar results. All source data in this figure are provided as a Source data file. |
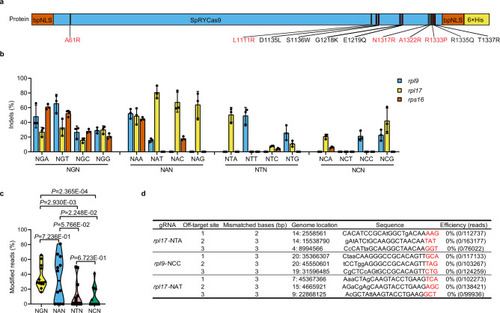
Optimized SpRYCas9 nuclease targeted different NNN PAMs in zebrafish.
a Schematic illustration of the amino acid mutations that developed SpRYCas9 from SpGCas9. Five more amino acid mutations (A61R, L1111R, N1317R, A1322R, and R1333P; in red) were introduced into SpGCas9 to obtain SpRYCas9. b The editing efficiency of 48 gRNAs targeting NNN PAMs of rpl9, rpl17, and rps16 in zebrafish. (Values are presented as mean value ± standard deviation (SD), n = 3 biological replicates). c Assessment of the preference of SpRYCas9-mediated mutagenesis for the second N of NNN PAMs using the violin plot based on the data in b, Each data point represents the averaged editing activity at the particular site. The centre line shows means of all data points. Two-tailed paired t test were performed (with P values marked). d Detection of mutation at potential off-target sites induced by SpRYCas9 nuclease at three loci using NGS. The PAM sequences are underlined in red. All source data in this figure are provided as a Source data file. |

Efficient cytosine base editing mediated by SpRY-CBE4max across various PAMs.
a The mRNA construct of SpRY-CBE4max used for cytosine base editing in zebrafish. b Summary of C-to-T base editing efficiency of various loci with NRN PAMs induced by SpRY-CBE4max editor in zebrafish. The position of the editing base in the gRNA was labelled with numbers. (Values are presented as mean value ± standard deviation (SD), n = 3 biological replicates) c Schematic diagram and sequencing results of mitfa (E318K) mutation induced by SpRY-CBE4max. The PAM sequences are underlined in red, the detected nucleotide changes are highlighted in blue, the targeted amino acids are highlighted in bold, the nucleotide substitutions are indicated by a red arrowhead in the sequencing chromatograms, and the synonymous mutations induced by SpRY-CBE4max are indicated with a blue arrowhead. d Lateral view of 2 dpf F0 embryos injected with mitfa (E318K) gRNA and SpRY-CBE4max mRNA showing pigmentation defects. Scale bar: 1 mm. This experiment was repeated three times independently with similar results. e On-target, product purity and off-target analysis of SpRY-CBE4max induced C-to-T editing at rpl17-NTA, ddx21-NGA and mitfa-NAT sites using NGS. The PAM sequences are underlined in red. NA: Not Applicable. All source data in this figure are provided as a Source data file. |
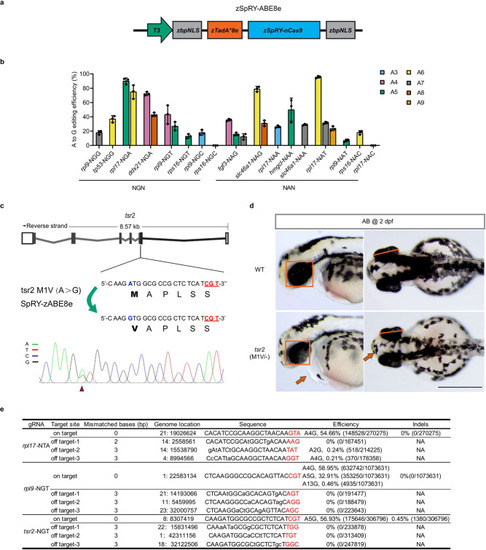
Efficient adenine base editing mediated by zSpRY-ABE8e across various PAMs.
a The mRNA construct of zSpRY-ABE8e used for adenine base editing in zebrafish. b Summary of A-to-G base editing efficiency of various loci with NRN PAMs induced by zSpRY-ABE8e editor in zebrafish. The position of editing base in the gRNA was labelled with numbers. (Values are presented as mean value ± standard deviation (SD), n = 3 biological replicates.) c Schematic diagram and sequencing results of tsr2 (M1V) mutation induced by zSpRY-ABE8e in zebrafish. The PAM sequences are underlined in red, the detected nucleotide changes are highlighted in blue, the targeted amino acids are highlighted in bold, and the nucleotide substitutions are indicated with a red arrowhead in the sequencing chromatograms. d Morphological phenotype of tsr2 (M1V)/−-deficient embryos at 2 dpf. The comparison of eye size is underlined with a red frame in the lateral view and with diameter measurement in the dorsal view. Red arrows indicate a pointy head and slight pericardial oedema of tsr2 (M1V)/− mutants. Scale bar: 500 μm. This experiment was repeated three times independently with similar results. e On-target, product purity and off-target analysis of zSpRY-ABE8e induced A-to-G editing at rpl17-NTA, rpl9-NGT and tsr2-NGT sites using NGS. The PAM sequences are underlined in red. NA: Not Applicable. All source data in this figure are provided as a Source data file. |