
|
Fig. 1
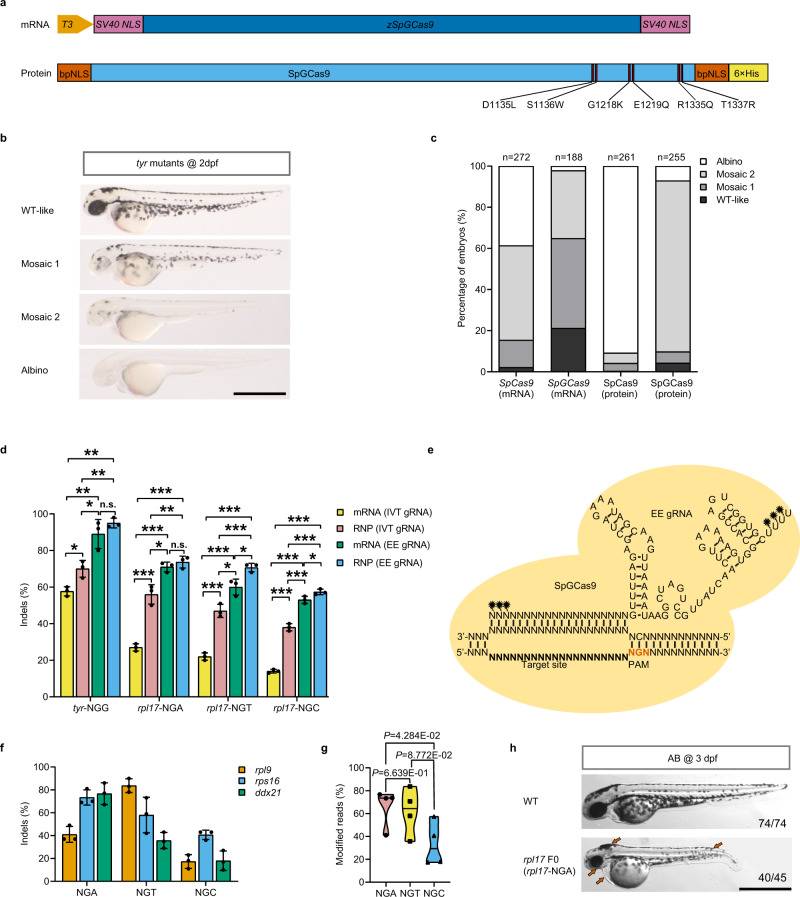
a Schematic illustration of codon-optimized SpGCas9 mRNA (zSpGCas9) and prokaryotic-expressed SpGCas9 protein. Six specific amino acid mutations (D1135L, S1136W, G1218K, E1219Q, R1335Q, and T1337R) were introduced into the SpCas9 amino acid sequence to obtain SpGCas9. b Biallelic disruption of tyrosinase (tyr) by SpGCas9 generates mosaic pigmentation phenotypes. Lateral views of 2 dpf embryos are shown. The mosaic pigmentation degree (WT-like, mosaic 1, mosaic 2, albino) compared with wild-type (WT) is defined in Supplementary Fig.. Scale bars: 1 mm. This experiment was repeated 3 times independently with similar results. c Phenotype statistics of embryos injected with SpCas9 mRNA/gRNA duplex, SpGCas9 mRNA/gRNA duplex, SpCas9: gRNA RNP complex, and SpGCas9: gRNA RNP complex. The stacked columns indicate the percentages of albino (white), mosaic 2 (light grey), mosaic 1 (medium grey), and WT-like (dark grey) zebrafish related to b. The total number of embryos was shown above each column. d Bar plot of indel efficiency edited by SpGCas9 mRNA/gRNA duplex or SpGCas9: gRNA RNP complex containing IVT gRNAs (in vitro-transcribed gRNA) or EE gRNAs (EasyEdit gRNA) across tyr-NGG, rpl17-NGA, rpl17-NGT and rpl17-NGC PAM sites. Editing efficiency was assessed by targeted Sanger sequencing and ICE analysis (values are presented as mean value ± standard deviation (SD), n = 3 biological replicates). Data were analysed by two-tailed paired t test. *P ≤ 0.05, **P ≤ 0.01, and ***P ≤ 0.001 (n.s. not significant). The exact P values are listed in Supplementary Data 6. e A schematic diagram of the sequence and secondary structure of EE gRNA loaded into SpGCas9 protein and bound to the genomic target site. The chemically modified nucleotides are labelled with black stars. f The editing efficiency of SpGCas9 at 9 targets with NGH PAMs in the genes rpl9, rps16 and ddx21 (values are presented as mean value ± standard deviation (SD), n = 3 biological replicates). g Assessment of the preference of SpGCas9-mediated mutagenesis for the last N of NGN PAMs using the violin plot. Each data point represents the averaged editing activity at the particular site. The centre line shows means of all data points. Two-tailed paired t test were performed (with P values marked). h Lateral views of SpGCas9:rpl17 EE gRNA (targeting NGA PAM) RNP complex induced mutated F0 at 3 dpf. Red arrows indicate the specific features of rpl17 mutants. Scale bar: 1 mm. this experiment was repeated 3 times independently with similar results. All source data in this figure are provided as a Source data file.