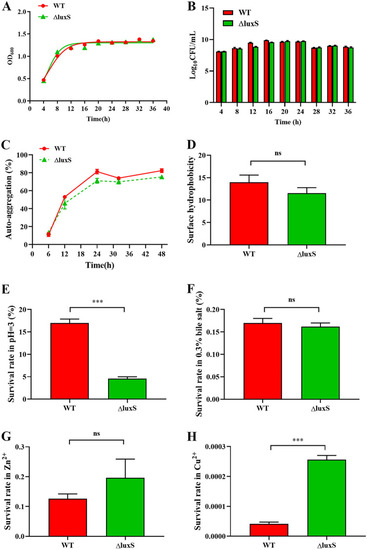
Physiological characteristics and stress resistance in WT and ΔluxS strain. (A–B) WT and ΔluxS were counted after being cultured for 4, 8, 12, 16, 20, 24, 28, 32 and 36 h in MRS. (C) Autoaggregation. (D) Surface hydrophobicity. (E-H) Survival rates in hydrochloric acid, bile salts (0.3%), copper ions and zinc ions (100 mg/L), n = 6. WT, wild type; ΔluxS, luxS mutant; P < 0.001 (***).

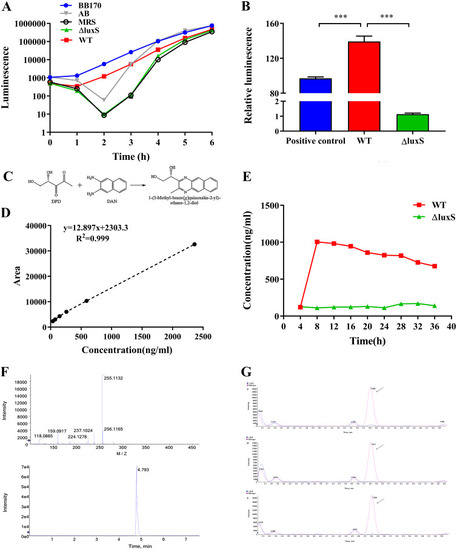
AI-2 activity of LGG wild-type or ΔluxS. (A) Detection of AI-2 activity in the supernatant of the wild-type strain and ΔluxS mutant after inducing V. harveyi BB170 to emit light. The supernatant of V. harveyi BB170, AB liquid medium, and MRS liquid medium were used as positive, negative and medium controls, respectively, n = 6. (B) Relative luminescence compared to the negative control at 24 h, n = 6. P < 0.001 (***). (C) The process of 4,5-dihydroxy 2,3-pentanedione (DPD) derivatization. It was an atypical condensation reaction with the loss of two water molecules. (D) Standard curve of AI-2 detected by HPLC-FLD. (E) Quantitative detection of AI-2 in the supernatant of LGG strains from different time points by HPLC-FLD. (F) MS spectra of the derived product of DPD. (G) Representative chromatograms of LGG supernatant (8h, 16h, 24h). WT, wild type; ΔluxS, luxS mutant; red, wild type; blue, ΔluxS strain.

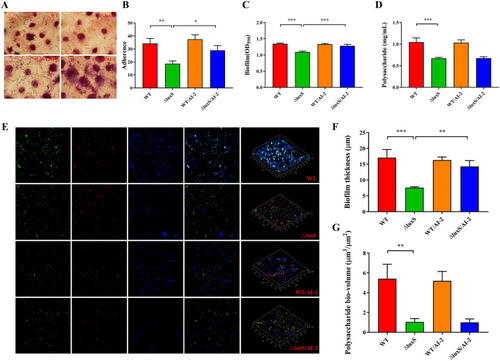
Adherence capacity, biofilm formation and exopolysaccharide (EPS) production of the LGG wild type versus △luxS in the presence or absence of exogenous, synthesized AI-2 (1 μM). (A–B) Adherence of LGG strains to IPEC-J2 cells. Five fields of vision were randomly selected for each slide under oil microscope to calculate the number of bacteria adhered to the surface of the visible cells, n = 6. (C) Biofilm determined by crystal violet staining, n = 6. (D) EPS produced in the biofilm matrix, n = 6. (E-G) Confocal laser scanning microscopy (CLSM) staining of living cells, dead cells, and EPS by SYTO9 (green), PI (red) and calcofluor white (blue), respectively, n = 3. AI-2, autoinducer-2; WT, wild type; ΔluxS, luxS mutant; WT/AI-2, wild-type strain supplemented with AI-2; ΔluxS/AI-2, ΔluxS strain supplemented with AI-2. P < 0.05 (*), P < 0.01 (**) and P < 0.001 (***).

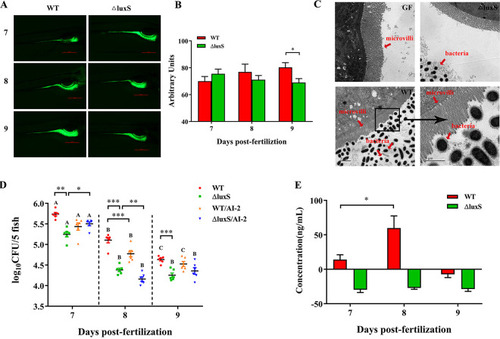
Colonization of germ-free zebrafish larvae by LGG wild-type and ΔluxS strain. (A–B) Analysis of LGG colonization in zebrafish gut on 7, 8 and 9 dpf by fluorescence microscopy, n = 9-12. Scale bar: 500 px. (C) Analysis of LGG colonization in zebrafish gut on 6 dpf by transmission electron microscopy. The figure shows germ-free zebrafish (GF), as well as germ-free zebrafish immersed in WT and ΔluxS. Red arrows point to microvilli and bacteria, respectively. Scale bar: 2 μm or 1 μm. (D) Colony-forming unit (CFU) counts of zebrafish larvae in the presence or absence of exogenous, synthesized AI-2 (1 μM), n = 6. (E) Determination of AI-2 content in zebrafish on 7, 8 and 9 dpf by HPLC-FLD, n = 3. AI-2, autoinducer-2; WT, wild type; ΔluxS, luxS mutant; WT/AI-2, wild-type strain supplemented with AI-2; ΔluxS/AI-2, ΔluxS strain supplemented with AI-2. P < 0.05 (*), P < 0.01 (**) and P < 0.001 (***). A negative value in the figure indicates that its concentration is too low and did not meet the detection baseline.

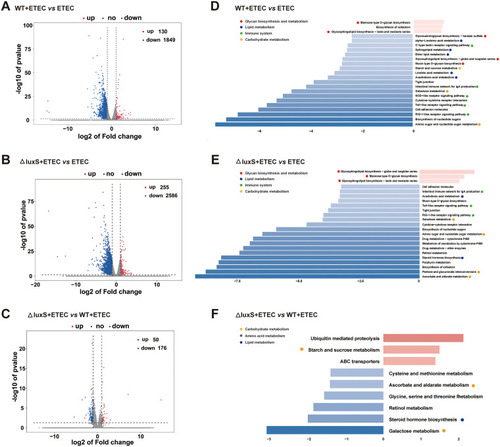
Transcriptomic analysis of zebrafish larvae. (A–C) Volcano plots of DEGs. Log2 (Fold change) ≥1 was set as the threshold. (D–F) Pathway classification based on KEGG enrichment analysis of DEGs. We enriched the differential genes according to Log2 (Fold change) ≥1, upregulated genes P < 0.1, and downregulated genes P < 0.05 for KEGG functional enrichment. We selected the top 20 pathways for presentation. Red: Glycan biosynthesis and metabolism. Blue: lipid metabolism. Green: immune system. Yellow: carbohydrate metabolism. Gray: amino acid metabolism. ETEC, WT+ETEC and ΔluxS+ETEC, zebrafish larvae in germ-free were exposed to none or to wild-type or ΔluxS LGG at a concentration of 108 CFU/mL for 24 h on 5 dpf, respectively, before being exposed to ETEC at a concentration of 108 CFU/mL for 24 h on 6 dpf.

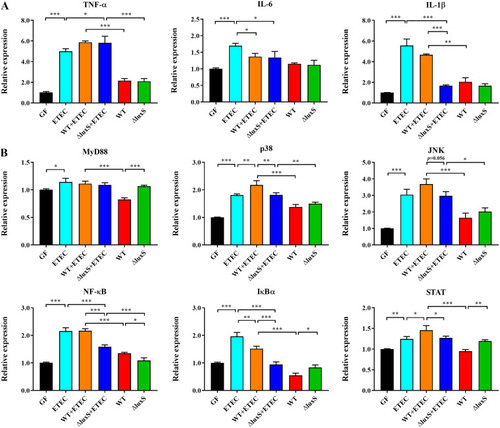
Characterization of inflammatory response in germ-free zebrafish larvae expose to ETEC. (A) mRNA expression of tumor necrosis factor-α (TNF-α), interleukin-6 (IL-6) and interleukin-1β (IL-1β). (B) mRNA expression of genes involved in mitogen-activated protein kinases (MAPK), nuclear transcription factor-kappa B (NF-κB) and Janus kinase/signal transducer and activator of transcription (JAK/STAT) signaling pathway, n = 6. GF, WT and ΔluxS, zebrafish larvae in germ-free were exposed to none or to wild-type or ΔluxS LGG at a concentration of 108 CFU/mL for 24 h on 5 dpf, respectively. ETEC, WT+ETEC and ΔluxS+ETEC, zebrafish larvae in germ-free were exposed to none or to wild-type or ΔluxS LGG at a concentration of 108 CFU/mL for 24 h on 5 dpf, respectively, before being exposed to ETEC at a concentration of 108 CFU/mL for 24 h on 6 dpf. P < 0.05 (*), P < 0.01 (**) and P < 0.001 (***).

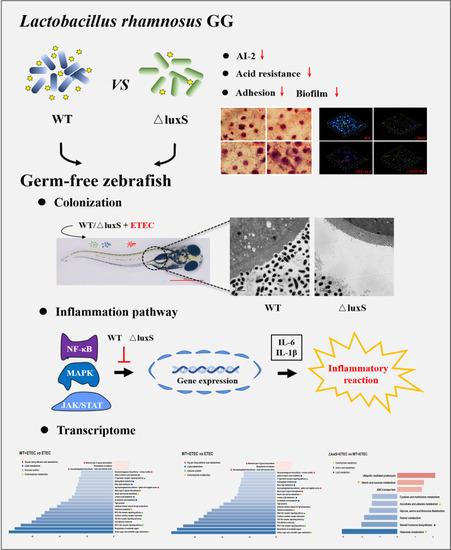
Abstract graphic. Our study compared the difference between the wild-type strain (WT) of Lactobacillus rhamnosus GG (LGG) and its luxS mutant strain (ΔluxS). In addition, the colonization and immunomodulatory effects of WT and ΔluxS were evaluated in the germ-free zebrafish model.

Acknowledgments
This image is the copyrighted work of the attributed author or publisher, and ZFIN has permission only to display this image to its users. Additional permissions should be obtained from the applicable author or publisher of the image. Full text @ Microbiol Spectr