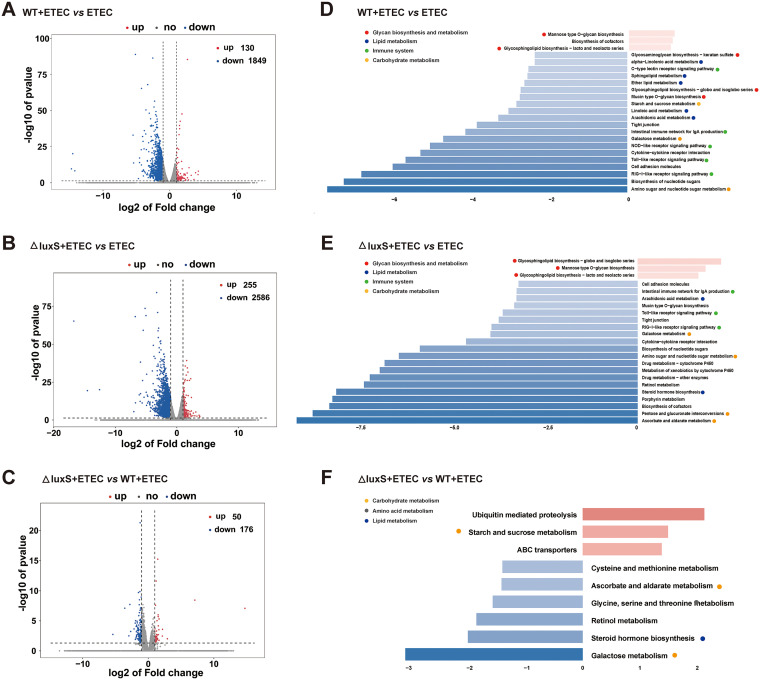
IMAGE

FIG 5

ID
ZDB-IMAGE-220903-17
Source
Figures for Deng et al., 2022
Image
Figure Caption

FIG 5

Transcriptomic analysis of zebrafish larvae. (A–C) Volcano plots of DEGs. Log2 (Fold change) ≥1 was set as the threshold. (D–F) Pathway classification based on KEGG enrichment analysis of DEGs. We enriched the differential genes according to Log2 (Fold change) ≥1, upregulated genes P < 0.1, and downregulated genes P < 0.05 for KEGG functional enrichment. We selected the top 20 pathways for presentation. Red: Glycan biosynthesis and metabolism. Blue: lipid metabolism. Green: immune system. Yellow: carbohydrate metabolism. Gray: amino acid metabolism. ETEC, WT+ETEC and ΔluxS+ETEC, zebrafish larvae in germ-free were exposed to none or to wild-type or ΔluxS LGG at a concentration of 108 CFU/mL for 24 h on 5 dpf, respectively, before being exposed to ETEC at a concentration of 108 CFU/mL for 24 h on 6 dpf.

Acknowledgments
This image is the copyrighted work of the attributed author or publisher, and ZFIN has permission only to display this image to its users. Additional permissions should be obtained from the applicable author or publisher of the image. Full text @ Microbiol Spectr