
- Title
-
Macrophages trigger cardiomyocyte proliferation by increasing epicardial vegfaa expression during larval zebrafish heart regeneration
- Authors
- Bruton, F.A., Kaveh, A., Ross-Stewart, K.M., Matrone, G., Oremek, M.E.M., Solomonidis, E.G., Tucker, C.S., Mullins, J.J., Lucas, C.D., Brittan, M., Taylor, J.M., Rossi, A.G., Denvir, M.A.
- Source
- Full text @ Dev. Cell

Figure 1. Cardiac macrophages display heterogeneity and plasticity following injury (A) Schematic illustrating the cardiac laser injury model, with imaging time points marked (left) and the injury site at ventricular apex of a 3 dpf larval heart marked (magenta circle) (right). (B) Representative lateral-view epifluorescence images of uninjured and injured hearts at the standard time points in Tg(mpeg1:GFP;csf1ra:gal4:UAS:NfsB-mCherry) (abbreviated to mpeg1:GFP;csf1ra:mCherry in all panels) illustrating macrophage heterogeneity; white arrow, ventricular apex; dashed line, heart outline. (C) Quantification of the number of csf1ra+mpeg1−, csf1ra-mpeg1+, and csf1ra+mpeg1+ macrophages on the ventricle in uninjured and injured larvae at standard time points, n = 10–12. (D) Representative LSFM image of csf1ra−mpeg1+ and csf1ra+mpeg1+ macrophages of different morphologies. (E) Representative LSFM image of tnfa+mpeg1+ and tnfa−mpeg1+ macrophages. (F) Quantification of the number of tnfa+mpeg1+ and tnfa−mpeg1+ macrophages on the ventricle in uninjured and injured larvae at standard time points, n = 10–25. (G) Quantification of the percentage of tnfa+ macrophages at 24 hpi following injection with IFN-γ-rel or PBS, n = 10. (H) Time-lapse time points for injured Tg(tnfa:GFP;mpeg1:mCherry) ventricles imaged live in the larvae by heartbeat-synchronized LSFM microscopy illustrating macrophage plasticity. Timestamps indicated, dashed line, ventricle outline; arrows, macrophage converting to tnfa+. Scale bars, 50 μm in (B) and (H) and 10 μm in (D) and (E). ∗∗ p ≤ 0.01, ∗∗∗ p ≤ 0.001, ∗∗∗∗ p ≤ 0.0001 (C and F). Two-way ANOVA followed by Holm-Sidak’s post-hoc test and (G) t test. Data are represented as mean ± SEM. |

Figure 2. Macrophages are required for the timely removal of apoptotic cardiomyocytes (A–C) (A) Images of uninjured and injured Tg(myl7:h2b-GFP;myl7:mKateCAAX) ventricles. Cyan outlined zoom panel highlights condensed nuclei (white arrowheads). Images of TUNEL stained hearts 6 hpi in (B) Tg(myl7:h2b-GFP) and (C) Tg(myl7:GFP) larvae. White arrowheads, apoptotic cardiomyocytes/myocardium.propidium iodide (PI)-stained (E) Images of uninjured and injured irf8+/+ and irf8−/− Tg(myl7:h2b-GFP) ventricles stained by TUNEL at 24 hpi. White arrowheads, TUNEL+ cells. (F) Images of uninjured and injured Tg(myl7:h2b-GFP;csfr1a:NfsB-mCherry) ventricles stained by TUNEL per macrophage ablation model injury group at 24 hpi. Cyan arrowheads, macrophages; white arrowheads, TUNEL+ cells. (G) TUNEL+ myocardial cells in uninjured and injured, irf8+/+ and irf8−/− Tg(myl7:h2b-GFP) ventricles, n = 15–29. (H) TUNEL+ myocardial cells in uninjured and injured Tg(myl7:h2b-GFP;csfr1a:NfsB-mCherry) ventricles per macrophage ablation group, n = 10–12. (I) z slice of LSFM-acquired z stack, at 9 hpi, showing internalized myocardial debris (white arrowheads) in a macrophage in a Tg(myl7:GFP;mpeg1:mCherry) larva, V, ventricle-surface. Scale bars, 50 μm for (A)–(F) and 10 μm for (I). All representative images are 3D LSFM shown as maximum intensity projections unless otherwise stated. ∗ p ≤ 0.05, ∗∗ p ≤ 0.01, ∗∗∗ p ≤ 0.001. Two-way ANOVA followed by Holm-Sidak’s post-hoc tests. Data are represented as mean ± SEM. |

Figure 3. Macrophages not required for the recovery of cardiac structure or function (A) Representative GFP surface renders of LSFM z stacks of injured ventricles in Tg(myl7:GFP;csfr1a:NfsB-mCherry) larvae, macrophage ablation groups as indicated in the figure. Abluminal myocardial surface is shown at 6 hpi (left), and abluminal and luminal surfaces are shown at 48 hpi following regeneration (middle and right). White arrowheads, laser lesion. (B) Quantification of mean lesion size in injured Tg(myl7:GFP;csfr1a:NfsB-mCherry) larvae per macrophage ablation group, n = 11–22. (C) Quantification of ventricular ejection fraction in uninjured and injured Tg(myl7:GFP;csfr1a:NfsB-mCherry) larvae per macrophage ablation group, n = 10–12. (D) Representative GFP surface renders of LSFM-acquired z stacks of injured ventricles from irf8+/+ and irf8−/− Tg(myl7:GFP) larvae. Abluminal myocardial surface is shown at 6 hpi (left), and abluminal and luminal surfaces are shown at 48 hpi following regeneration (middle and right). White arrowheads, laser lesion. (E) Quantification of mean lesion size in injured irf8+/+ and irf8−/− Tg(myl7:GFP) larvae, n = 15. (F) Quantification of ventricular ejection fraction in uninjured and injured irf8+/+ and irf8−/− Tg(myl7:GFP) larvae n = 15–20. (G) Time-lapse time points of a GFP-surface-rendered, injured Tg(myl7:GFP) ventricle from 6 hpi. White box, zoom panel; white arrowheads, myocardial buds; cyan arrowhead, myocardial bridge. ∗ p ≤ 0.05, ∗∗∗ p ≤ 0.001. Two-way ANOVA followed by Holm-Sidak’s post-hoc tests. Scale bars, 50 μm. Data are represented as mean ± SEM. |

Figure 4. Macrophage ablation abolishes injury-dependent cardiomyocyte proliferationEdU pulse strategy for labeling proliferating cardiomyocytes over 0–24 hpi (left) and 24–48 hpi (right). (B) Images of EdU-stained hearts from Tg(myl7:h2b-GFP) larvae at 48 hpi. Non-myocardial EdU signal is excluded post-acquisitionally. A, atrium; v, ventricle; white boxes, zoom panels; white arrowheads, EdU+ cardiomyocyte nuclei; dashed line, outline of dividing cardiomyocyte daughter nuclei. (C) Percentage of ventricular EdU+ cardiomyocytes in uninjured and injured Tg(myl7:h2b-GFP) hearts pulsed over 0–24 or 24–48 hpi. ∗∗∗ p ≤0.001 unpaired t test, n = 10–25. (D) EdU pulse strategy for labeling proliferating cardiomyocytes over 24–48 hpi in Tg(myl7:h2b-GFP;csfr1a:NfsB-mCherry) larvae per standard macrophage ablation groups. (E) Images of EdU-stained hearts from Tg(myl7:h2b-GFP;csfr1a:NfsB-mCherry) acquired by LSFM at 48 hpi. White boxes, zoom panels; white arrowheads, EdU+ cardiomyocyte nuclei; BA, bulbous arteriosus. (F) Percentage of ventricular EdU+ cardiomyocytes in uninjured and injured Tg(myl7:h2b-GFP;csfr1a:NfsB-mCherry) hearts pulsed over 24–48 hpi. ∗p ≤ 0.05 Kruskal-Wallis test and Dunn’s multiple comparison post-hoc test, n = 12–19. (G) Images of uninjured and injured EdU-stained hearts from irf8−/− Tg(myl7:h2b-GFP) acquired by LSFM at 48 hpi. Non-myocardial EdU signal is excluded post-acquisition to allow interpretable maximal intensity projections. (H) Percentage of ventricular EdU+ cardiomyocytes in uninjured and injured irf8+/+ and irf8−/− Tg(myl7:h2b-GFP) hearts pulsed 24–48 hpi, ∗∗ p ≤ 0.01 unpaired t test, n = 10–16. All images are maximum intensity projections of 3D LSFM stacks, unless otherwise stated. Scale bars, 50 μm. Data are represented as mean ± SEM. |

Figure 5. Bulk RNA-seq analysis of larval hearts following injury (A) Extraction of uninjured and injured hearts at 48 hpi and the pooling of 200 hearts per biological replicate for RNA-seq, n = 3. (B) Volcano plot showing the log2(fold change) and –log10(p value) for transcripts of each detected gene. Genes whose adjusted p values fall below 0.05 are deemed statistically non-significant and colored blue. Genes up regulated in injured hearts are colored magenta and those upregulated in uninjured hearts are colored gray. (C) Heatmap displaying statistically significantly differentially expressed genes with a log2(fold change) >0.5. Genes were hierarchically clustered by Pearson correlation with z scaling. Clusters are indicated on the left with their dendrogram. Magenta, high expression; gray, low expression. Genes with relevance to cardiac regeneration are highlighted as annotations on the right of the plot, n = 3. |
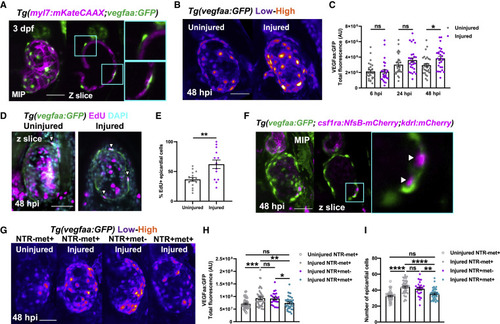
Figure 6. Macrophages stimulate epicardial cell number expansion following cardiac injury (A) Image of an uninjured 3 dpf ventricle from a Tg(myl7:mKateCAAX;myl7:h2b-GFP) larva showing vegfaa+ cells (green) overlying myocardium (magenta). Cyan box, zoom panel. (B) Images of uninjured and injured ventricles from Tg(vegfaa:GFP) larvae acquired at 48 hpi. “Heat” LUT is applied to highlight the increased intensity of epicardial vegfaa:GFP in injured hearts. (C) Total ventricular vegfaa:GFP fluorescence in uninjured and injured hearts over standard injury model time points, n = 28–30. ∗ p ≤ 0.05 one-way ANOVA followed by Holms-Sidak’s multiple comparison post-hoc tests. (D and E) Images of uninjured and injured EdU-stained Tg(vegfaa:GFP) hearts 48 hpi showing EdU+ epicardial cells (white arrowheads) and the proportion of EdU+ epicardial cells are quantified in (E), n = 13–16. Unpaired t test, ∗∗ p ≤ 0.01. (F) Image of a ventricle from a Tg(vegfaa:GFP;csfr1a:NfsB-mCherry;kdrl:hsa.HRAS-mCherry) (abbreviated to kdrl:mCherry) larva at 48 hpi showing macrophages in the epicardial-myocardial niche (white arrowheads). Cyan box, zoom panel. (G) Images of uninjured and injured ventricles from Tg(vegfaa:GFP;csfr1a:NfsB-mCherry) larvae from metronidazole-nitroreductase macrophage ablation groups at 48 hpi. “Heat” LUT is applied to highlight the increase in the overall fluorescence in injured groups except NTR+met+. Total vegfaa:GFP fluorescence (H) and epicardial cell number (I) in uninjured and injured ventricles from Tg(vegfaa:GFP;csfr1a:NfsB-mCherry) larvae from metronidazole-nitroreductase macrophage ablation groups at 48 hpi. All images are maximum intensity projections of 3D LSFM stacks. Scale bars, 50 μm, n = 46. ∗ p ≤ 0.05, ∗∗ p ≤ 0.01, ∗∗∗p ≤ 0.001. One-way ANOVA followed by Holms-Sidak’s multiple comparison post-hoc tests. Data are represented as mean ± SEM. |
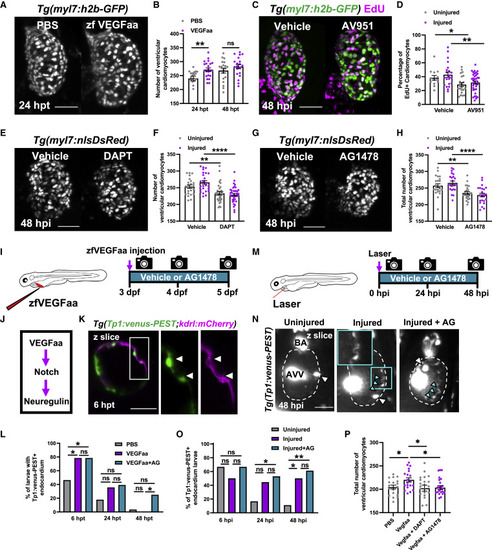
Figure 7. Vegfaa drives cardiomyocyte proliferation by endocardial notch signaling LSFM images of (B) Ventricular cardiomyocyte number in Tg(myl7:h2b-GFP) larvae at 24 and 48 hpi treated with PBS 0.1% BSA or zfVegfaa 0.1% BSA injection, n = 20. Unpaired t test. (C) Images of injured ventricles from Tg(myl7:h2b-GFP) larvae, EdU stained and bathed in vehicle or AV951, imaged at 48 hpi. Non-myocardial EdU signal is excluded post-acquisitionally. (D) Percentage of EdU+ cardiomyocyte nuclei from uninjured and injured ventricles from Tg(myl7:h2b-GFP) larvae, EdU stained and bathed in vehicle or AV951, n = 13–36. Unpaired t test. (E) Images of injured Tg(myl7:nlsDsRed) larvae treated with vehicle or DAPT, acquired at 48 hpi by LSFM. (F) Ventricular cardiomyocyte number in uninjured and injured Tg(myl7:h2b-GFP) larvae at 48 hpi treated with vehicle or DAPT, n = 24–40. Unpaired t test. (G) Images of injured Tg(myl7:nlsDsRed) larvae treated with vehicle or AG1478, acquired at 48 hpi by LSFM. (H) Ventricular cardiomyocyte number in uninjured and injured Tg(myl7:h2b-GFP) larvae at 48 hpi treated with vehicle or AG1478, n = 24. Unpaired t test. (I) Treatment strategy for the injection of uninjured larvae with zfVegfaa and continuous bathing in AG1478 solution. (J) Hypothesized signaling pathway active in uninjured and injured larval hearts driving cardiomyocyte proliferation. (K) LSFM-acquired z plane showing notch expression colocalizing with endocardium in Tg(Tp1:venus-PEST;kdrl:hsa.HRAS-mCherry), abbreviated in the figure to Tg(Tp1:venus-PEST;kdrl:mCherry). AG1478 abbreviated to AG; white box, zoom panel. (L) Proportion of larvae with notch+ endocardium at 6, 24, and 48 hpt following zfVegfaa injection and bathing in AG1478, n = 28. Fisher’s exact test. (M) Treatment strategy for the lasering of larvae and continuous bathing in AG1478 solution. (N) Representative z plane images of uninjured, injured, and injured AG-treated ventricles from Tg(tp1:venus-PEST) larvae at 48 hpi. BA, bulbous arteriosus; AVV, atrioventricular valve; white arrowheads, laterally inhibited cardiomyocytes; cyan arrowheads, notch+ endocardium; cyan box, zoom panel. Fisher’s exact test. (O) Proportion of larvae with notch+ endocardium at 6, 24, and 48 hpt following laser injury and bathing in AG1478, n = 18. (P) Cardiomyocyte number at 48 hpi following injection with recombinant Vegfaa and continuous bathing in DAPT or AG1478, n = 22–25. One-way ANOVA followed by Holms-Sidak’s multiple comparison post-hoc tests. All images are maximum intensity projections of 3D LSFM stacks unless otherwise stated. Scale bars, 50 μm. Data are represented as mean ± SEM, ∗ p ≤ 0.05, ∗∗ p ≤ 0.01, ∗∗∗ p ≤ 0.001, and ∗∗∗∗p ≤ 0.0001. |
Reprinted from Developmental Cell, 57(12), Bruton, F.A., Kaveh, A., Ross-Stewart, K.M., Matrone, G., Oremek, M.E.M., Solomonidis, E.G., Tucker, C.S., Mullins, J.J., Lucas, C.D., Brittan, M., Taylor, J.M., Rossi, A.G., Denvir, M.A., Macrophages trigger cardiomyocyte proliferation by increasing epicardial vegfaa expression during larval zebrafish heart regeneration, 1512-1528.e5, Copyright (2022) with permission from Elsevier. Full text @ Dev. Cell