
- Title
-
Comparing the folding landscapes of evolutionarily divergent procaspase-3
- Authors
- Yao, L., Clark, A.C.
- Source
- Full text @ Biosci. Rep.
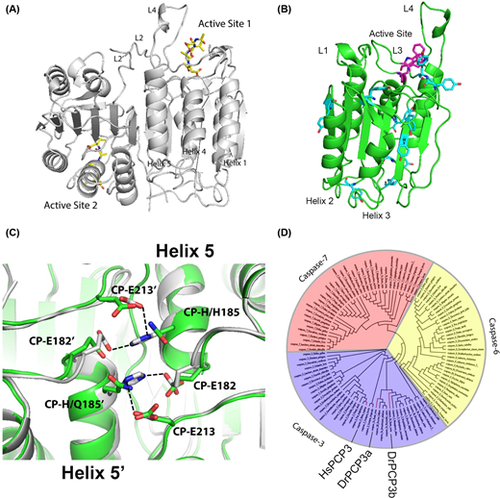
Caspase structure and phylogeny (A) Structure of human caspase-3 dimer is shown in gray (PDB ID: 1CP3). Inhibitors are shown in yellow, and active site loops L2, L2’ and L4 are labeled. (B) Caspase protomer with active site tryptophans (magenta) and tyrosines (cyan) labeled. Active site loops L1, L3 and L4 are shown, and helices 2 and 3 are labeled. (C) Comparison of contacts across the dimer interface (helix 5) for zebrafish caspase-3b (green) (modeled from human caspase-3) and human caspase-3 (gray) (PDB ID: 1CP3). CP refers to the common position numbering system as described in the text. Dashed lines show hydrogen bonds. (D) Phylogenetic tree of effector caspases. Caspase-3, -6 and -7 are marked in purple, yellow and red, respectively. Human caspase-3 (HsPCP3), zebrafish caspase-3a (DrPCP3a) and -3b (DrPCP3b) are labeled and shown by the red lines. |
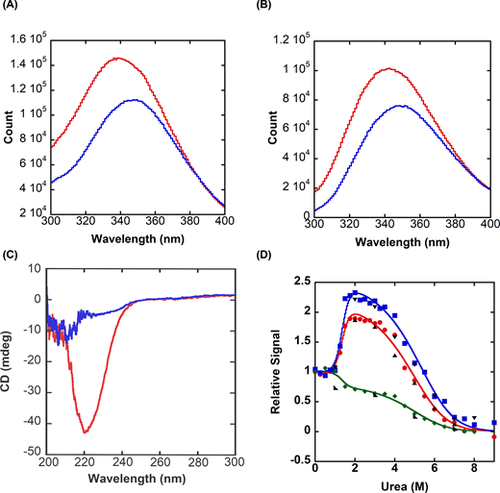
Spectroscopic properties of zebrafish procaspase-3b (CP-C117S) (A) Fluorescence emission scan of DrPCP3b following excitation at 280 nm in buffer containing zero urea (red) or 8 M urea (blue). (B) Fluorescence emission scan of DrPCP3b following excitation at 295 nm in buffer containing zero urea (red) or 8 M urea (blue). (C) Circular dichroism (CD) far-UV scan of DrPCP3b in buffer containing zero urea (red) or 8 M urea (blue). (D) Representative equilibrium unfolding/folding of DrPCP3b at pH 7 by fluorescence emission (average emission wavelength) following excitation at 280 nm ( |
 ), 295 nm (
 ), and CD at 224 nm (
 ). Refolding data for fluorescence emission (280 nm (▲) and 295 nm (▼)) and CD (◣) show that folding is reversible. Solid lines represent global fits to a three-state folding model, as described in the text.

Effect of pH on the DrPCP3b dimer (A) Average emission wavelength following excitation at 280 nm (red) or 295 nm (blue) versus pH for DrPCP3b. Solid lines represent fits of the data to determine the pKa of the transition, as described in the text. (B) Size exclusion chromatography of DrPCP3b over the pH range shown in panel (A). Protein was incubated citrate buffer at pH 5 (red), pH 6 (blue), and pH 6.5 (green), and in phosphate buffer at pH 7.5 (black) and pH 8 (magenta). The column was standardized as described in the text to determine the molecular weight of 70 kDa for the single peak in the chromatograms. |

Fraction of species as a function of urea concentration over the pH range of 5 to 8.5 The fractions of species versus urea concentration at pH 5 (A), pH 5.5 (B), pH 6 (C), pH 6.5 (D), pH 7 (E), pH 7.5 (F), pH 8 (G) and pH 8.5 (H) were calculated from global fits of the equilibrium folding/unfolding data shown in Supplemental Figures S2 and S3, the parameters shown in Table 1, and the protein concentrations of 0.5, 1, 2 and 4 µM. Each species, N2, I2, I2’, U, is labeled in the figures. N2 refers to the native dimer of DrPCP3b, while I2’ and I2 refer to partially folded intermediate conformations of the dimer, and U refers to the unfolded state of the protein. |

Conformational free energy of DrPCP3b versus pH (A) The midpoint of the transition between native dimer (N2) and the first dimeric folding intermediate (I2) (●). The solid line represents a fit of the data to determine pKa, as described in the text. (B) Free energies for (●), (■), (♦) and (▲) versus pH. (C) Cooperativity indices, m1 (●), m2 (■), m3 (♦) and mtotal (▲) versus pH. Data for panels (B and C) were determined from global fits of the data shown in Supplementary Figure S2 and S3 to the models shown in (eqns 2 and 3), as described in the text. The error bars show the standard error obtained from the global fits. |