
Image
|
Figure Caption
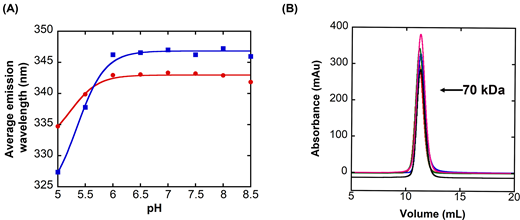
Fig. 3
Effect of pH on the DrPCP3b dimer
(A) Average emission wavelength following excitation at 280 nm (red) or 295 nm (blue) versus pH for DrPCP3b. Solid lines represent fits of the data to determine the pKa of the transition, as described in the text. (B) Size exclusion chromatography of DrPCP3b over the pH range shown in panel (A). Protein was incubated citrate buffer at pH 5 (red), pH 6 (blue), and pH 6.5 (green), and in phosphate buffer at pH 7.5 (black) and pH 8 (magenta). The column was standardized as described in the text to determine the molecular weight of 70 kDa for the single peak in the chromatograms.
Acknowledgments
This image is the copyrighted work of the attributed author or publisher, and
ZFIN has permission only to display this image to its users.
Additional permissions should be obtained from the applicable author or publisher of the image.
Full text @ Biosci. Rep.