
- Title
-
Gnetum montanum extract induces apoptosis by inhibiting the activation of AKT in SW480 human colon cancer cells
- Authors
- Pan, X., Hou, X., Zhang, F., Tang, P., Wan, W., Su, Z., Yang, Y., Wei, W., Du, Z., Deng, J., Hao, E.
- Source
- Full text @ Pharm Biol

Figure 1. The phytochemical profile of GME using HPLC-Q-TOF-MS/MS. (A) The base peak chromatogram of GME by LC–MS in negative mode. (B) The secondary fragment ion of gnetifolin A. |
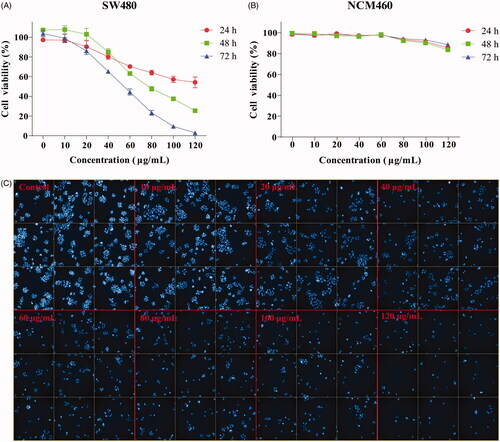
Figure 2. Effect of GME on the viability of colon cancer cells SW480. (A) Colon cancer cells SW480 were treated with GME at concentrations of 0–120 μg/mL in triplicates for 24, 48, and 72 h. (B) The human normal colonic epithelial cells NCM460 were treated with GME at concentrations of 0–120 μg/mL in triplicates for 24, 48, and 72 h. Cell viability was measured by MTS assay. (C) The SW480 cells were treated with GME for 48 h. Apoptotic bodies were stained with DAPI (4′,6-diamidino-2-phenylindole). The cell morphology changed significantly, and the nucleus contracted and rounded. The cells were observed under the Operetta CLS high-content analysis system at DAPI pathway. |
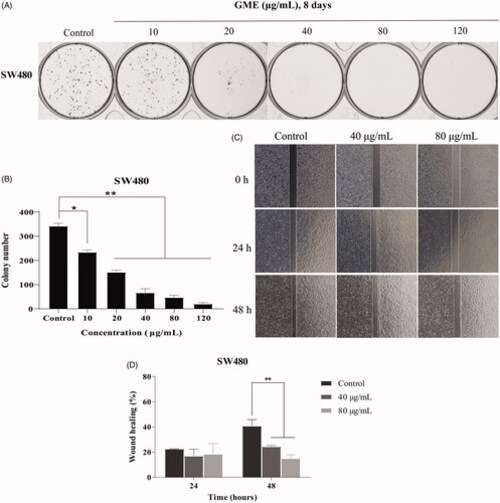
Figure 3. Clonogenic growth potential and migration of colon cancer cells SW480 treated with GME. (A) Evaluation of the clonogenic growth potential of SW480 cells treated with GME for 8 days. At the end of incubation, colony formation was observed by staining with crystal violet. Similar results were obtained in three independent experiments. (B) Record the colony number by a colony counter. (C) Wound healing assay was used to examine cellular migration, SW480 cells were allowed to grow into full confluence in 6-well plates, and then a wound was created with a pipette tip. GME (40 and 80 μg/mL) was added to the well and images were obtained using a microscope at 0, 24, and 48 h. Three independent experiments were examined and representative images were presented. (D) Percentage of wound healing rate. *p < 0.05; **p < 0.01. |
|
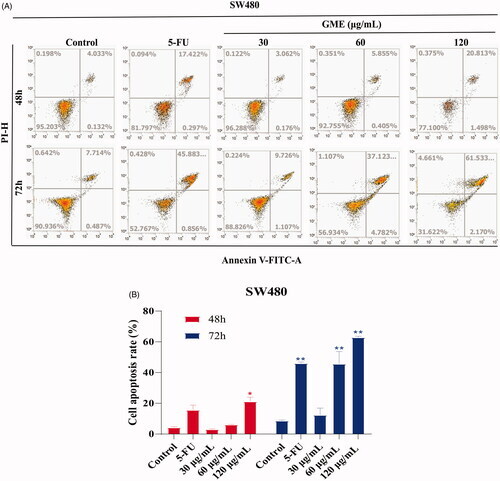
Figure 4. Effects of GME on apoptosis and cell cycle distribution in SW480 cells. (A) SW480 cells were treated with GME (30, 60, and 120 µg/mL) and 5-FU (20 μM) for 48 h, 72 and the cell apoptosis was detected by flow cytometry after propidium iodide (PI) and Annexin V staining. The Annexin V-negative/PI-negative cells (regarded as normal) are in the lower left quadrant and Annexin V-positive/PI-negative cells are early apoptotic cells in the lower right quadrant. Late apoptotic Annexin V-positive/PI-positive cells are in the upper right quadrant, and necrotic Annexin V-negative/PI-positive cells are in the upper left quadrant. (B) Quantitative representation of apoptotic cells in histogram. *p < 0.05; **p < 0.01. (C) Cell cycle distribution was detected by flow cytometry. (D) GME treatment for 48 h, histograms demonstrate the percentage of tumour cells at different phases of the cell cycle. (E) GME treatment for 72 h, histograms demonstrate the percentage of tumour cells at different phases of the cell cycle. Data are expressed as mean ± SD and percent of the control. **p < 0.01. 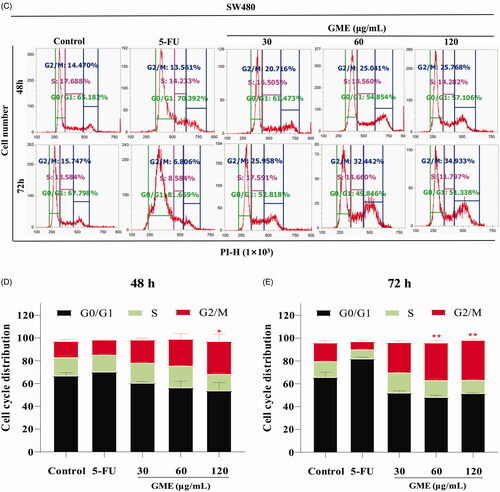
|
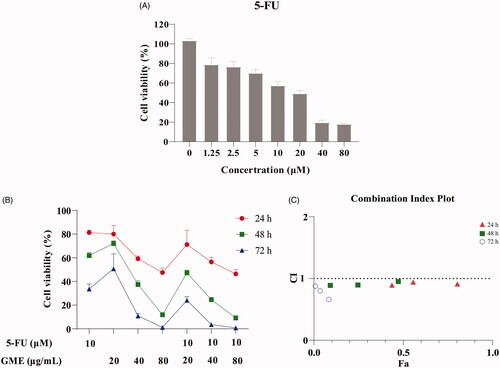
Figure 5. Effect of the combination of GME and 5-FU on SW480 cells. (A) The SW480 cells were treated with 5-FU (0–80 µM) for 48 h. Cell viability was measured by MTS assay. (B) The GME (20, 40, and 80 µg/mL) enhanced the anti-proliferative activity with 5-FU (10 μM), and the combination of the two has more potent synergistic effect on SW480 cells. (C) The CI values of GME and 5-FU combinations for 24, 48, and 72 h. The above data are all presented as the means ± SD of three independent experiments. |
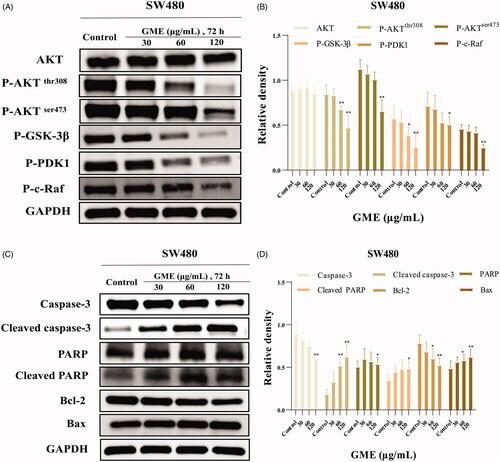
Figure 6. Effects of GME on PHOSPHO-AKT pathway in colon cancer cells SW480. (A) SW480 cells were treated with the absence or presence of GME for 72 h and harvested to measure protein levels of AKT, P-AKT, P-GSK-3β, P-PDK1 and P-c-Raf by western blotting. We used the housekeeping protein GAPDH as a positive loading control in all experiments. (B) Relative density of phospho-AKT signalling pathway proteins. (C) Apoptosis-related markers such as poly ADP ribose polymerase (PARP) cleavage, caspases activities and Bcl-2 family of proteins were detected by western blotting in SW480 cells. (D) Apoptosis-related protein relative density. |
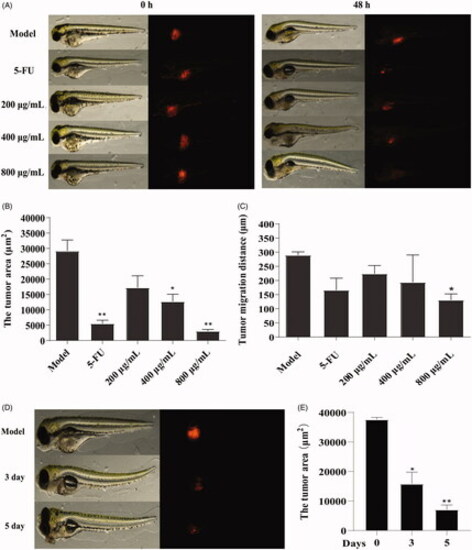
Figure 7. Effect of GME on xenograft zebrafish tumour model. (A) The SW480 cells were microinjected into zebrafish embryos (larvae stage, n = 10 per group). Fluorescence area was captured by fluorescence microscopy at 0 hpf and 48 hpf after treated with GME and 5-FU. (B) Compared with the model group, the tumour area was reduced in the treatment group. *p < 0.05; **p < 0.01. (C) Compared with the model group, the tumour migration distance was reduced in the treatment group. *p < 0.05. (D) Fluorescence area of the xenograft zebrafish tumour treated by GME (400 μg/mL) for 3 dpf and 5 dpf. (E) The tumour area significantly reduced, showing in a time-dependent manner. *p < 0.05; **p < 0.01. |

Figure 8. GME inhibited tumour growth in SW480-luc xenograft nude mice model. (A) Tumour volumes growth curves in treatment and model groups. Compared to model group: **p < 0.01. (B) At the end of the whole cycle, the tumour was removed and weighed. Compared with the model group, different treatment groups have significant differences: **p < 0.01. (C) Body weight measurements of mice in different groups throughout the treatment course. (D) Take white light photographs and bioluminescence imaging of SW480-luc cells xenograft mice model in different groups at the end of experiments. |