
|
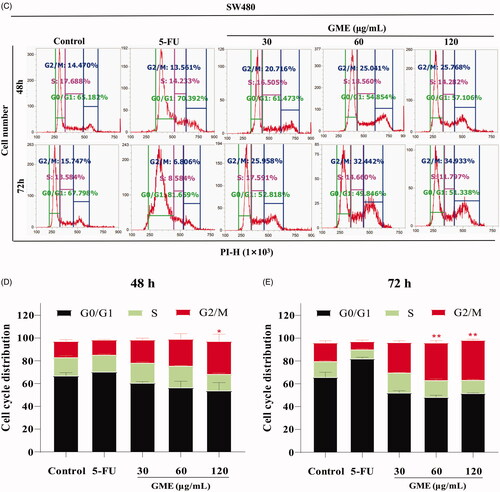
Fig. 4 Figure 4. Effects of GME on apoptosis and cell cycle distribution in SW480 cells. (A) SW480 cells were treated with GME (30, 60, and 120 µg/mL) and 5-FU (20 μM) for 48 h, 72 and the cell apoptosis was detected by flow cytometry after propidium iodide (PI) and Annexin V staining. The Annexin V-negative/PI-negative cells (regarded as normal) are in the lower left quadrant and Annexin V-positive/PI-negative cells are early apoptotic cells in the lower right quadrant. Late apoptotic Annexin V-positive/PI-positive cells are in the upper right quadrant, and necrotic Annexin V-negative/PI-positive cells are in the upper left quadrant. (B) Quantitative representation of apoptotic cells in histogram. *p < 0.05; **p < 0.01. (C) Cell cycle distribution was detected by flow cytometry. (D) GME treatment for 48 h, histograms demonstrate the percentage of tumour cells at different phases of the cell cycle. (E) GME treatment for 72 h, histograms demonstrate the percentage of tumour cells at different phases of the cell cycle. Data are expressed as mean ± SD and percent of the control. **p < 0.01.