FIGURE SUMMARY
Title

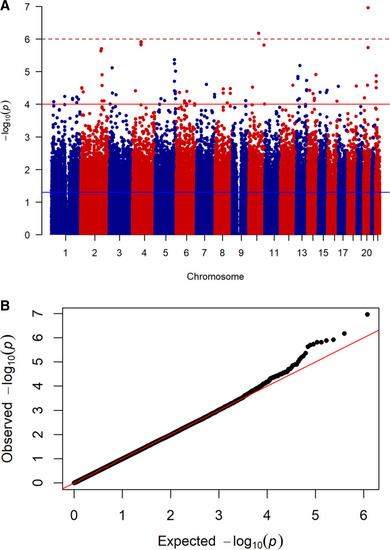
Genome-wide analysis identified novel susceptible genes of restless legs syndrome in migraineurs

Authors
Jiang, Y.J., Fann, C.S., Fuh, J.L., Chung, M.Y., Huang, H.Y., Chu, K.C., Wang, Y.F., Hsu, C.L., Kao, L.S., Chen, S.P., Wang, S.J.
Source
Full text @ J Headache Pain

A Manhattan plot for RLS association in patients with migraine. Manhattan plot of the discovery genome-wide association analysis of 115 cases and 635 controls. The x axis is chromosomal position, and the y axis is the significance (–log10 P) of association derived from Cochran–Armitage trend tests. B Quantile–quantile plot of results from the Cochran-Mantel–Haenszel analysis. Red line represents the distribution of P values under the null hypothesis, given a study inflation factor (λ) of 1.000

Regional plots of association signals. Regional plots for two newly identified loci associated with risk of restless legs syndrome in patients with migraine. Each regional plot shows the chromosomal position (GRCh37/hg19) of SNPs in the specific region against –log10P values from association results of genotyped and imputed SNPs in stage 1 GWAS samples and stage 2 replication samples

Expression of tyrosine hydroxylase (th) and fin movement frequency in ccdc141 and vstm2l morphants. In situ hybridization was conducted with tyrosine hydroxylase antisense RNA probe. At 3 dpf, (A) in ccdc141 5’UTR (MO1) morphants, the distribution of th is dispersed and the th-expressing amacrine cells (red arrows) are decreased; in vstm2l splicing (MO2) morphants, lower th expression in dorsal pretectum (red asterisk), DC7 neurons (red square) and amacrine cells was observed; and the distribution of th in sympathetic superior cervical ganglion (SCG, green rectangle) is decreased and dispersed. Of note, the th expression in locus coeruleus (LC) and medulla oblongata (MeO) neurons does not alter. For quantification before th in situ experiments, the morphants were separated into groups according to their phenotypic severity. The results showed that fewer th-expressing amacrine cells were observed in every group, including wt-like (P1) group in (B) 4.5 dpf ccdc141 MO1 morphants and (C) 4 dpf vstm2l MO2 morphants, whose statistical data are shown in (D) embryos injected with 1 ng ccdc141 MO1 morpholino and (E) embryos injected with 16 ng vstm2l MO2 morpholino, respectively. Note that (F) amacrine cell deceasing phenotype was rescued by co-injecting ccdc141 mRNA into ccdc141 morphants. G Hyperkinetic movements were observed in vstm2l MO2 morphants with significant differences. H The ccdc141 MO1 morphants had a trend of hyperkinetic movements, though the P value was not significant. (In these experiments, ccdc141 MO1 morphants were injected with 0.5 ng ccdc141 MO1 morpholino, and vstm2l MO2 morphants were injected with 16 ng vstm2l MO2 morpholino. Only wild-type like embryos were used to conduct experiments.) (N number for (A) AB = 2, ccdc141 MO1_1ng = 7, AB = 4, vstm2l MO2_16ng = 41, vstm2l MO2_16ng_ severe phenotype = 9. (D) AB = 5, MO-P1 = 6, MO-P2 = 24, MO-P3 = 2, MO = 32. (E) AB = 13, MO-P1 = 6, MO-P2 = 17, MO-P3 = 11, MO-P4 = 4, MO = 38. (F) AB = 21, MO1 = 18, MO1 + mRNA = 25. Gvstm2l AB = 5, vstm2l MO2 = 4. Hccdc141 AB = 10, ccdc141 MO1 = 9.) (Mann–Whitney U test was used for comparisons of unpaired nonparametric variables. All calculated P-values were two-tailed, and statistical significance was defined as P-value less than 0.05. Symbol meaning: *, p ≤ 0.05; **, p ≤ 0.01; ***, p ≤ 0.001; ****: p ≤ 0.0001)

The quantity of amacrine cells and flapping frequency of pectoral fins in the transient ccdc141 and vstm2l knocked-out embryos. The statistical data showed that fewer th-expressing amacrine cells were observed in 4 dpf (A) ccdc141 and vstm2l exon 1 (E1) knocked-out embryos. A statistically significant hyperkinetic movements were found in 5 dpf (B) ccdc141 and vstm2l exon 1 knocked-out embryos. Fewer th-expressing amacrine cells were observed with statistical data in 4 dpf (C) ccdc141 and vstm2l exon 2 (E2) knocked-out embryos. Hyperkinetic movements were found statistically significant in 5 dpf (D) ccdc141 and vstm2l exon 2 knocked-out embryos, when compared to tracrRNA-Cas9 control. The not-injected AB wildtype embryos were used as no inj. control; for the exon 1-targeting knockouts in (A) and (B), 200 pg tracrRNA and 200 pg Cas9 protein were injected per embryo as basic tracrRNA-Cas9; basic tracrRNA-Cas9 and 50 pg ccdc141-crRNA E1/vstm2l-crRNA E1 were injected per embryo for ccdc141 exon 1/vstm2l exon 1 KO. For the exon 2-targeting knockouts in (C) and (D), 138 pg tracrRNA and 461 pg Cas9 protein were injected per embryo as basic tracrRNA-Cas9; basic tracrRNA-Cas9 and 34.6 pg ccdc141-crRNA E2/vstm2l-crRNA E2 were injected per embryo for ccdc141 exon 2/vstm2l exon 2 KO. Mann–Whitney U test was used for comparisons of unpaired nonparametric variables. All calculated P-values were two-tailed, and statistical significance was defined as P-value less than 0.05. Symbol meaning: *, p ≤ 0.05; **, p ≤ 0.01; ***, p ≤ 0.001; ****, p ≤ 0.0001

Acknowledgments
This image is the copyrighted work of the attributed author or publisher, and ZFIN has permission only to display this image to its users. Additional permissions should be obtained from the applicable author or publisher of the image. Full text @ J Headache Pain