
- Title
-
Regional synapse gain and loss accompany memory formation in larval zebrafish
- Authors
- Dempsey, W.P., Du, Z., Nadtochiy, A., Smith, C.D., Czajkowski, K., Andreev, A., Robson, D.N., Li, J.M., Applebaum, S., Truong, T.V., Kesselman, C., Fraser, S.E., Arnold, D.B.
- Source
- Full text @ Proc. Natl. Acad. Sci. USA

Tail Flick Conditioning (TFC), a CC paradigm for larval zebrafish. (A) The head of the zebrafish undergoing TFC is encased in low-melt agarose, leaving the tail free to move. The CS consists of light from a green LED; the US is heat produced by an NIR laser. The CR is tail flicking. (B) Timeline of the TFC paradigm. (C) During training, fish are exposed to both the CS and US. In response to the US, all fish flicked their tails vigorously (black bars). Here, we display late-stage training rounds for three L and three NL fish. (D) During the testing phase of TFC, the fish is exposed to the CS alone. L respond immediately upon presentation of CS; NL do not. Here, early-stage testing rounds are shown. (E) Cumulative histogram of the percentage of larval zebrafish that respond with tail flicking to the five CSs presented during testing one or more times, two or more times, etc. (After TFC, inverted triangles). The baseline flicking histograms from fish during the final rounds of Habituation (Before TFC, gray triangles) or from fish assayed after TFC for five time windows when no stimulus is present (Random, filled squares) are different. (F) The FR (fraction of time tail is flicking) when US is presented during training are similar for L (n = 11 fish), PL (n = 6), NL (n = 11), and US only (US, n = 11) and different from the FR during the same time period for fish exposed to CS only (n = 11) or NS(n = 11; ***P < 0.005, *P < 0.05, Kruskal–Wallis test). No pairwise comparison between L, PL, NL, or US is significant except for L versus PL (*P < 0.05, Kruskal–Wallis test). (G) The FR in response to the CS during testing is significantly different in fish exposed to TFC versus control fish (***P < 0.0001, Kolmogorov–Smirnov test). Cumulative probability distributions are shown. (H) The FR (averaged for all fish during testing) is significantly reduced in fish exposed to 2-amino-5-phosphonovaleric acid (APV) during TFC compared to control fish (n = 12 fish +APV, 19 fish −APV; **P < 0.01, Mann–Whitney U test). Each data point represents the response to a single presentation of the CS. (I) The FR diminishes over 30 presentations of CS alone (extinction, n = 5) in a set of L fish by ∼75%. (J) FR before and after extinction (Ext, t1 and t2) are significantly different (***P < 0.005, n = 5 as in H, Mann–Whitney U test). FR at t1, t2 without extinction (n = 6) are not significantly different (P > 0.05, Mann–Whitney U test). Data available at https://doi.org/10.25551/1/1-1YZE (45). |

Neuronal activation within the anterolateral pallium in response to the CS in learner fish and to the US in naïve fish. (A) Intense immunostaining of pERK in the pallium (magenta highlighted region, Inset) of an L fish exposed to 5 CSs following TFC. The strong signal in an anterolateral region (yellow outline) of this optical section reveals regional neuronal activation. Relatively less immunostaining is present in the medial pallium (cyan outline). (B) An NL fish shows a lack of pERK staining in the anterolateral region (yellow outline) after exposure to 5 CSs in this equivalent optical section. (C) A naïve fish reveals strong pERK staining in the same anterolateral region (yellow outline) after exposure to 10 USs. Equivalent optical section to those in A and B. (D) A naïve fish exposed to 10 CSs does not show concentrated pERK labeling in the anterolateral region (yellow outline). Optical section equivalent to those in A–C. (E) A naïve fish not exposed to a CS or US (NS) does not show concentrated pERK labeling in the anterolateral region (yellow outline). Optical section equivalent to those in A–D. (F) L and US-exposed naïve subjects show a significantly higher lateral:medial pERK intensity ratio compared to NL and naïve untreated subjects (*P < 0.02, ***P < 0.005, n = 5 fish per group, Kruskal–Wallis multiple comparison test). White dashed lines mark the border of the pallium (midline = M) in A–E. (Scale bar for A–E, 20 µm.) Data available at https://doi.org/10.25551/1/1-1JP0 (50). |

Imaging excitatory synapses in larval zebrafish. (A) Confocal image of neurons coexpressing PSD-95.FingR-GFP (green) and membrane-targeted mScarlet (magenta) in the pallium of a living 14 dpf zebrafish larva. Subset maximum intensity projection of the boxed region is to the right. (Top Right) PSD-95.FingR-GFP puncta colocalize with the tips of spine-like projections. (Middle) PSD-95.FingR-GFP. (Bottom) mScarlet (“RFP”). Arrows point to spine-like projections that colocalize with PSD-95.FingR-GFP puncta. (Bottom Right) Intensities of PSD-95.FingR labeling at individual puncta were roughly proportional to intensities of mScarlet labeling at the same puncta; for cells shown at left, R = 0.68). (B) Schematic of TFC/SPIM imaging experiments. The zebrafish is rotated by θ = 25° from the fluorescence detection axis (green arrow) to avoid illuminating the eyes with the incident light sheet (blue arrow). (C) Dorsal view of a 15 dpf larval zebrafish head with pallium region imaged by SPIM outlined with dashed white line. (D) Maximum intensity projection of a stack of SPIM images of PSD-95.FingR (red outlined region in C) showing synaptic puncta and a bright nucleus (N). (E) Map of synapses identified from D (see Materials and Methods). Gray scale intensity reflects total PSD-95.FingR labeling for each punctum. (Scale bar in A, 5 µm; C, 100 µm; D and E, 10 µm.) Data available at https://doi.org/10.25551/1/1-1JP2 (58). |

Synapse changes with TFC in larval zebrafish. (A) Total number of synapses before (t1) and after (t2) TFC for individual fish (P > 0.05 for L, PL, US, NS, and CS; *P < 0.05 for NL, Wilcoxon test). (B) Dorsal view of all identified excitatory synapses in the left pallium (highlighted in inset) of a learner fish before (white) and after (magenta) TFC alignment of the two synapse images was accomplished by manually identifying and then computationally aligning the labeled nuclei (not shown in images). (C) Schematic of algorithm to identify synapses lost or gained following TFC. All synapses were grouped into pairs, one from before TFC and the second from after, such that the distance between the pair is minimized. Each synapse could only be part of a single pair. All pairs separated by a distance greater than or equal to 4 μm are considered different synapses (i.e., lost if from before TFC or gained if from after). (D) Dorsal view of lost (cyan) and gained (yellow) synapses following TFC from the learner fish shown in B reveals more lost synapses medially and more gained synapses laterally. (E–G) Synapse turnover in fish before and after TFC did not show significant variation between different categories of fish (P > 0.05, Kruskal–Wallis test) except for PL and NS (loss fraction and unchanged fraction, P < 0.05, Dunn’s multiple comparison test). (Scale bars, 20 μm.) n = 11 L, 6 PL, 11 NL, 11 US, 11 NS, and 11 CS fish. Data available at: https://doi.org/10.25551/1/1-1Z04 (59). |
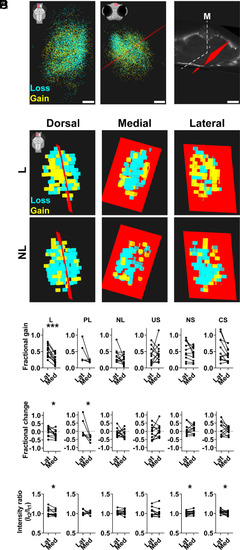
Regional differences in synapse formation in the pallium of learner fish. (A, Left) Map of lost (cyan) or gained (yellow) synapses in the left pallium following TFC for L fish in dorsal view (highlighted in inset, midline to the right). Results from each fish were registered onto a canonical fish prior to pooling (SI Appendix, Fig. S7). (Middle) Coronal view of pooled L results shows a DB plane (red) that optimally divides the left pallium into two regions of differential synapse change: dorsomedially, synapse loss predominates; ventrolaterally, synapse gain predominates (region highlighted in inset; midline to the left). (Right) Slightly tilted 3D coronal view of DB plane for L fish (red) shown against the outline of the canonical zebrafish brain (gray; M: midplane). (B) Dorsal (highlighted in inset cartoon, medial to the right), medial, and lateral views of voxelized aggregate synaptic data in L and NL fish. Each voxel represents a region with predominant synapse loss (cyan) or gain (yellow) following TFC. The DB plane (red) derived from L separates a region of predominant synapse gain (ventrolaterally) and loss (dorsomedially) in L; the same plane does not separate loss and gain in NL. (C) Synapse fractional gain analysis for each group reveals that learners have gained significantly more (∼30%) synapses ventrolaterally versus dorsomedially relative to the DB plane (***P < 0.005, Wilcoxon test). PL, NL, and control groups do not show a significant difference in synapse gain between the two sides of the DB plane (P > 0.05, Wilcoxon test). (D) Fractional change in synapses (gained minus lost) is significantly higher ventrolaterally versus dorsomedially in L and PL (*P < 0.05, Wilcoxon test) but not in any other groups (P > 0.05, Wilcoxon test). (E) The ratio of PSD-95.FingR-GFP fluorescence intensity per synapse before and after TFC (It2/It1) is negligibly different in medial versus lateral regions in L (∼1% difference), CS, and NS (≤5% difference, *P < 0.05, Wilcoxon test), and in US, PL, and NL (<4%, P > 0.05, Wilcoxon test). (Scale bar, 20 µm.) Voxel dimensions in B, 10 µm. n = 11 L, 6 PL, 11 NL, 11 US, 11 NS, and 11 CS fish. Data available at https://doi.org/10.25551/1/1-1Z06 (60). |

Anatomical correlation of regions of increased neuronal activity and synaptic gain following TFC. (A) Coronal (Left), dorsomedial (Middle), and ventrolateral (Right) views of the region of increased pERK labeling in the left pallium of learner fish (see inset cartoon) exposed to CS. pERK staining is located mainly on the ventrolateral side of the DB plane, where synapse gain predominates in learners. (B) Five individually photoconverted cells (see Materials and Methods), whose cell bodies lie within the pERK staining area of the pallium shown in A, have processes that are predominantly (∼90%) on the ventrolateral side of the DB plane. Coronal (Left), dorsomedial (Middle), and ventrolateral (Right) views. Magenta asterisks in left and right subpanels indicate the position of cell bodies. (C) Volumes defined by the dendrites of medial (blue) and anterolateral (orange) cells, corresponding to regions outlined in cyan and yellow, respectively, in Fig. 2 A–E. (D) Fractional synapse gain is significantly higher for L (***P < 0.005, Wilcoxon test) and PL (*P < 0.05, Wilcoxon test) in the anterolateral region than in the dorsomedial region but not in NL. (E) Fractional synapse change (gained synapses minus lost synapses) is also significantly higher in L and PL (*P < 0.05, Wilcoxon test) but not in NL. (Scale bars in A and B, 30 µm. Scale bar in C, 100 µm.) Data available at https://doi.org/10.25551/1/1-1Z08 (62). |