
|
Fig. 3
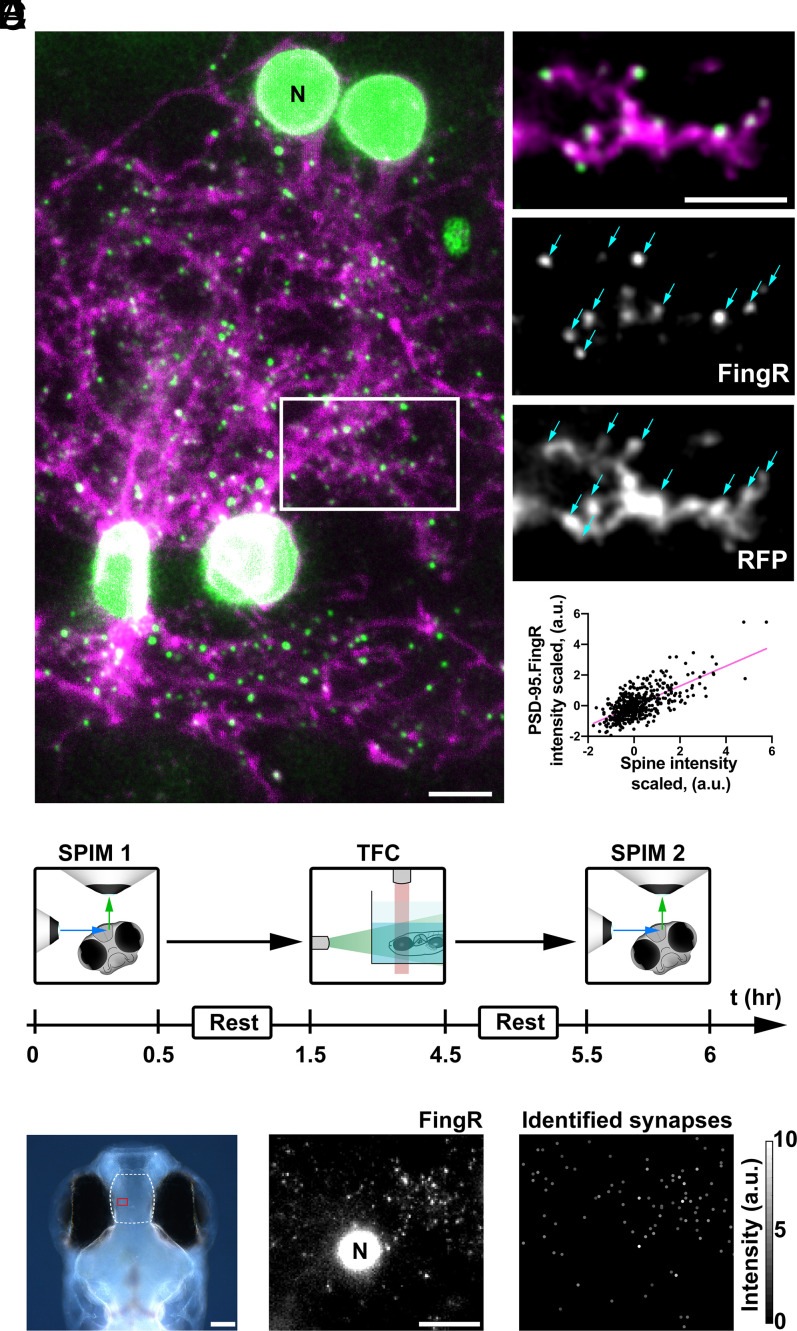
Imaging excitatory synapses in larval zebrafish. (A) Confocal image of neurons coexpressing PSD-95.FingR-GFP (green) and membrane-targeted mScarlet (magenta) in the pallium of a living 14 dpf zebrafish larva. Subset maximum intensity projection of the boxed region is to the right. (Top Right) PSD-95.FingR-GFP puncta colocalize with the tips of spine-like projections. (Middle) PSD-95.FingR-GFP. (Bottom) mScarlet (“RFP”). Arrows point to spine-like projections that colocalize with PSD-95.FingR-GFP puncta. (Bottom Right) Intensities of PSD-95.FingR labeling at individual puncta were roughly proportional to intensities of mScarlet labeling at the same puncta; for cells shown at left, R = 0.68). (B) Schematic of TFC/SPIM imaging experiments. The zebrafish is rotated by θ = 25° from the fluorescence detection axis (green arrow) to avoid illuminating the eyes with the incident light sheet (blue arrow). (C) Dorsal view of a 15 dpf larval zebrafish head with pallium region imaged by SPIM outlined with dashed white line. (D) Maximum intensity projection of a stack of SPIM images of PSD-95.FingR (red outlined region in C) showing synaptic puncta and a bright nucleus (N). (E) Map of synapses identified from D (see Materials and Methods). Gray scale intensity reflects total PSD-95.FingR labeling for each punctum. (Scale bar in A, 5 µm; C, 100 µm; D and E, 10 µm.) Data available at https://doi.org/10.25551/1/1-1JP2 (58).