FIGURE SUMMARY
Title

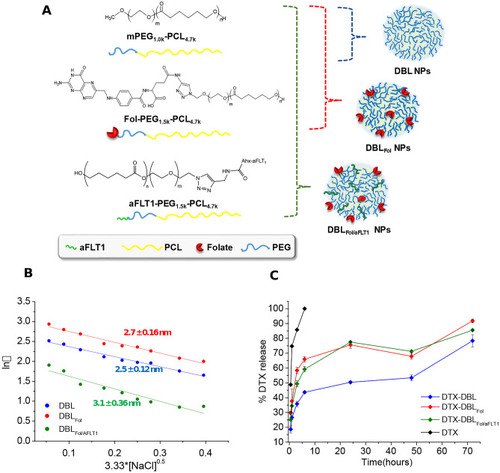
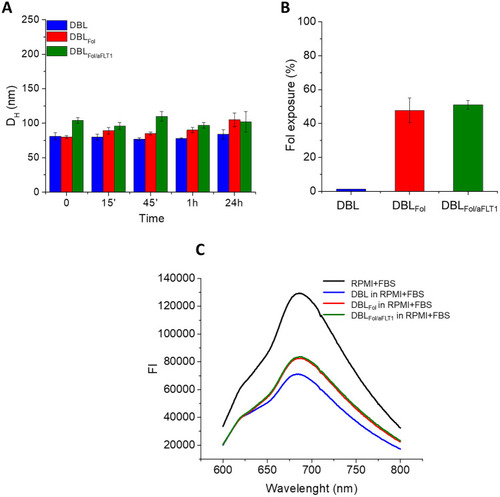
Biodegradable nanoparticles combining cancer cell targeting and anti-angiogenic activity for synergistic chemotherapy in epithelial cancer

Authors
Moret, F., Conte, C., Esposito, D., Dal Poggetto, G., Avitabile, C., Ungaro, F., Tiso, N., Romanelli, A., Laurienzo, P., Reddi, E., Quaglia, F.
Source
Full text @ Drug Deliv Transl Res

A Chemical structure of the copolymers employed to prepare NPs. B Representative Fixed aqueous layer thickness (FALT) measurements evaluated by monitoring the zeta potential of NPs dispersed in NaCl solutions in water ([NPs] = 250 μg/mL): the slope of the straight line represents the thickness of the outer hydrophilic shell expressed in nm. C Docetaxel (DTX) release from NPs in PBS 10 mM pH 7.4, at 37 °C evaluated by the dialysis method. Results are the mean values ± SD of three measurements carried out on three different NPs batches

A Hydrodynamic diameter of NPs after incubation in PBS pH 7.4 at 37 °C at different time points ([NPs] = 1 mg/mL). B Percentage of folate exposure on NP surface measured by incubating NPs (5 mg/mL) with a monoclonal anti-folic acid antibody. Results are the mean values ± SD of three measurements carried out on three different NPs batches. C Fluorescence emission spectra of RPMI with 10% of FBS at Ex = 278 nm in the presence of DBL NPs, DBLFol NPs and DBLFol/aFLT1 ([NPs] = 1 mg/mL). The reduction of the emission of RPMI + FBS indicates an interaction between NPs and the protein

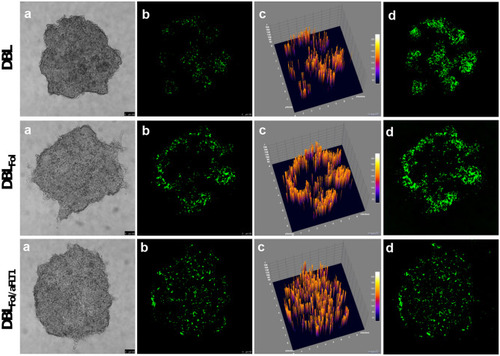
Confocal images of KB spheroids after treatment with DiO-loaded NPs (50 µg/mL) for 48 h: a bright-field; b DiO fluorescence acquired in the equatorial plane of the spheroid; c 3D reconstruction of the distribution of the fluorescence signal in the equatorial plane of the spheroid; d maximum projection obtained by superimposing the images of the 20 acquired focal planes. Scale bars: 100 μm

Cytotoxicity of DTX-loaded NPs in KB spheroids. A Percentage of residual ATP in the spheroid measured using the CellTiter-Glo® 3D Cell Viability Assay after 72 h of treatment with DTX-loaded NPs or with the free drug ([DTX] = 0.001–1 μg/mL). Data are mean values ± SD of at least three independent experiments carried out in triplicate. *p < 0.05, **p < 0.01, ***p < 0.001 vs. free DTX (Student’s t-test). B Bright-field images of spheroids acquired by confocal microscopy after 72 h of treatment with DTX-loaded NPs at different doses. Scale bars: 100 μm

Toxicity and activity of DTX-loaded NPs in the zebrafish embryo xenograft model. A Timeline of the in vivo experiments. The microscopy image shows 3 embryos xenografted with KB cells (red fluorescence). B Toxicity of NPs in xenograft zebrafish embryos injected with DTX and DTX-loaded NPs ([DTX] = 2.5 ng/animal) after 6 days from the treatment. C Tumor volume reduction after 6 days from the treatment with DTX-loaded NPs ([DTX] = 2.5 ng/animal). Total tumor fluorescence quantified from images. §p < 0.05; §§p < 0.01; §§§p < 0.001 vs. ctrl; *p < 0.001 vs. free DTX. D Representative images of KB cells xenotransplanted in the embryo yolks. Scale bars: 500 μm

Vasculature analysis of fli1a:EGFP embryos after two days of treatment with nanoparticles (NPs) ([DTX] = 2.5 ng/animal). Fluorescence microscopy images of untreated embryos without (A) or with KB xenografted cells (B); embryos with KB xenografted cells and treated with free DTX (C) or DTX-DBLFol/aFLT1 (D). B1 is a magnification showing the presence of vascular branches (white circles) sprouting toward tumor masses in untreated embryos. In the magnification, D1 vascular branches are not visible due to the anti-angiogenic effect exerted by DTX-DBLFol/aFLT1. Scale bar: 250 μm. Red: tumor cells stained with DiI; green: zebrafish embryo vasculature

Acknowledgments
This image is the copyrighted work of the attributed author or publisher, and ZFIN has permission only to display this image to its users. Additional permissions should be obtained from the applicable author or publisher of the image. Full text @ Drug Deliv Transl Res