
- Title
-
Mandipropamid as a chemical inducer of proximity for in vivo applications
- Authors
- Ziegler, M.J., Yserentant, K., Dunsing, V., Middel, V., Gralak, A.J., Pakari, K., Bargstedt, J., Kern, C., Petrich, A., Chiantia, S., Strähle, U., Herten, D.P., Wombacher, R.
- Source
- Full text @ Nat. Chem. Biol.

Mandi, a new CIP.
a, Chemically induced protein proximity to control interactions between proteins of interest A and B. b, Chemical structure of Mandi. c, Live-cell confocal microscopy of COS-7 cells cotransfected with pLYN-mCherry-PYRMandi and enhanced green fluorescent protein peGFP-ABI before and 2 min after Mandi addition (100 nM); data are representative of seven cells. d, Live-cell confocal microscopy of COS-7 cells transfected with pvimentin-mNeonGreen-PYRMandi-IRES-Halo-ABI and labeled with HaloTag ligand-SiR (HTL-SiR). Images were acquired before and 5 min after Mandi addition (50 nM); data are representative of 20 cells. The scale bars in c and d represent 10 µm. See Extended Data Fig. Fig.22 for single-channel images. |
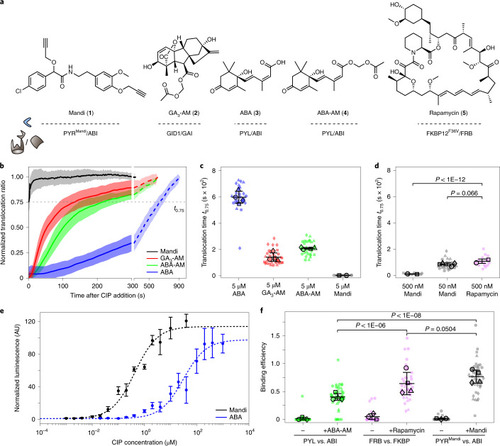
Quantitative comparison of the new Mandi system with existing CIP systems.
a, Chemical structure of different CIP systems and their respective receptor and receiver domains. b, Single-cell translocation kinetics of the cytosolic receiver domain to the receptor domain localized on mitochondria. Trajectories were normalized to ratios before CIP addition and after translocation was completed. Data represent mean (line) ± s.d. (shaded region). See Supplementary Table 2 for number of cells and experiments. CIPs were injected at a 5 µM final concentration at t = 0 s. The translocation time, t0.75, is indicated by the dashed line. See Supplementary Fig. 4 for single-cell translocation trajectories and Supplementary Fig. 5 for averaged trajectories from experiments with reduced Mandi concentrations. c,d, Translocation times for different CIPs and CIP concentrations. Small symbols represent individual cells, and large symbols represent means from experiments. See Supplementary Table 2 for the number of cells and experiments for each condition. The means ± s.d. across experiments are indicated by error bars. e, Dose–response (median ± s.d.) of ABA- or Mandi-induced luciferase expression in COS-7 cells after 24 h of incubation. Four (7) samples from three (4) independent experiments for Mandi (ABA-AM). f, Binding efficiencies from RSICS experiments before and after CIP addition at a 500 nM final concentration. Lines indicate mean ± s.d., and symbols are as described in c. Conditions were compared using a two-sided unpaired t-test with Welch’s correction. Source data |

Protein translocation in living zebrafish embryos.
a, Schematic illustration of workflow for in vivo application in zebrafish embryos. Fertilized eggs were injected with vectors for LYN–mCherry–PYRMandi or TOM20–mCherry–PYRMandi and eGFP–ABI expression, resulting in mosaic expression of target proteins at 3–5 dpf. b–d, Confocal microscopy images of different cell types (fin cells (b), epithelial cells (c) and muscle cells (d)) in living zebrafish embryos expressing receiver and plasma membrane-localized receptor domains before and 10–20 min after addition of 500 nM Mandi are shown. Data are representative of ≥three independent experiments for each cell type; scale bar, 40 µm. |
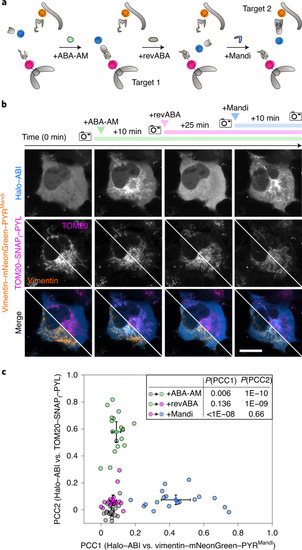
Reversible and dynamic protein shuttling in living cells. a, Schematic illustration of the four-step procedure to shuttle cytosolic protein between different intracellular targets. b, Confocal fluorescence microscopy images of the shuttling process between vimentin and mitochondria in a living cell. COS-7 cells were cotransfected with vimentin-mNeonGreen-PYRMandi-IRES-Halo-ABI and TOM20-SNAPf-PYL. Halo–ABI and SNAPf–PYL were labeled with HTL-SiR and tetramethylrhodamine (TMR)-Star, respectively. The top row shows dynamic receiver localization, and the middle row shows receptor localizations as references. Split images depict vimentin and mitochondrial localization in two different channels. The bottom row shows respective merges. Images were acquired at the indicated times before and after the addition of ABA-AM (200 nM), after the addition of revABA (20 μM) and after the addition of Mandi (200 nM); scale bar 20 µm. Data are representative of 22 cells from two independent experiments. c, Pearson correlation coefficients (PCC; mean ± s.d.) between receiver and respective receptor channel images at the indicated time points for four-step shuttling between cytosol, mitochondria and vimentin as shown in b. Small symbols represent individual cells at the indicated time points. In the inset, conditions were compared with a two-sided paired t-test. |