
- Title
-
Extracellular hyaluronate pressure shaped by cellular tethers drives tissue morphogenesis
- Authors
- Munjal, A., Hannezo, E., Tsai, T.Y., Mitchison, T.J., Megason, S.G.
- Source
- Full text @ Cell
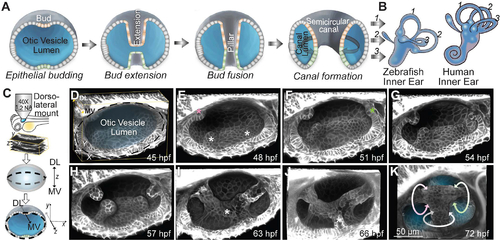
In toto imaging of the developing zebrafish inner ear reveals multi-scale dynamics during semicircular canal morphogenesis
(A) Illustrations showing the formation of a SCC. (B) Illustrations of the inner ears from adult zebrafish and human comparing the conserved structures of the SCCs. Anterior, posterior and lateral SCCs are labelled as 1, 2 and 3 respectively. (C) Workflow for zebrafish embryo mounting, image acquisition and visualization. (D-K) 3D rendered otic vesicles (OVs) at select time points using Tg(βActin:membrane-Citrine). Anterior to the left and dorso-lateral (DL) into plane of view. Lateral, anterior and posterior buds are marked by white, pink and green asterisks respectively. The buds extend (G and H), and fuse (I). Ventro-lateral and ventral buds form and extend (marked by white asterisks) (I and J). Bud fusion demarcates the hubs for the anterior, posterior and lateral SCC (marked by pink, green and white circular arrows respectively) (K). Scale bar, 50 μm. |

Stereotypical morphogenic behaviors are not responsible for SCC morphogenesis
(A and B) 3D rendered representative examples of OVs with DAPI and EdU staining marking all nuclei (grey) and nuclei in S phase (purple) respectively, in control (A), and Hydroxyurea (HU)+Aphidicolin treated embryos (B) at 54 hpf. Lateral buds are marked by white asterisks and anterior bud is marked by yellow asterisks. Anterior to the left and DL into the plane of view. Scale bar, 50 μm. (C) Individual data points and mean±s.d. of percentage of EdU positive nuclei in the lateral region of the OV, and only in the buds. ‘n’ denotes the number of OVs. p values as labelled (Mann Whitney- U test). (D) Individual data points and mean±s.d. of bud lengths in control and HU+Aphidicolin treated embryos at 54 hpf. In the absence of buds, lengths correspond to cell lengths. ‘n’ denotes the number of buds. p values as labelled (Mann Whitney- U test). (E and F) 2D sections (E) and 3D rendering (F) of a posterior and an anterior bud respectively from membrane-labeled transgenic embryo at select time points with individual cells tracked (colored dots). Scale bar, 10 μm. (G and H) 2D sections from two different z-depths of an ablated OV (marked by red flash) using Tg(βActin:membrane-Citrine) (green) and Texas-red dextran (magenta) in the periotic space. Lateral buds (marked by white asterisks) can be seen in the DL section (L). Anterior bud (marked by yellow asterisk) can be seen in the MV section (L’). Dextran dye enters the OV lumen upon ablation (M-M’). Lateral buds continue to extend in the ablated OV (marked by white arrows) (M’). Posterior bud also forms and extends (cyan arrow). Anterior bud ablation blocks its extension (yellow asterisk) (M’). Scale bar, 50 μm. (I), OV lumen volume in control and experiment before and after ablation. ‘n’ denotes the number of OVs per condition. p values as labelled (Mann Whitney- U test). (J) Bud lengths in control and experimental embryos before and 4 hours post (hp) ablation. ‘n’ denotes number of buds measured per condition. p values as labelled (Mann Whitney- U test). (K) Illustrations show the models tested for budding morphogenesis. |
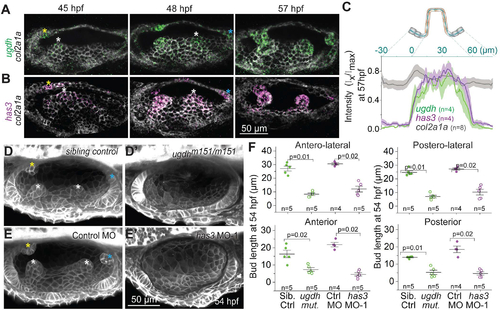
SCC morphogenesis requires patterned expression of hyaluronan synthesis enzymes ugdh and has3
(A and B) Maximum intensity projections of OVs at select time points stained with multiplex in situ probes against ugdh (green) and col2a1a (white) (A), and has3 (purple) and col2a1a (white) (B). The z-volume is different across time points to capture all the buds, and hence the contrast of each time point is individually set for better visualization. Scale bar, 50 μm. (C) Mean intensities±standard error (s.e.) of various genes across the illustrated region of interest (ROI) in the anterior bud at 57 hpf. (D and E) Representative examples of 3D-rendered OVs at 54 hpf from sibling control and ugdhm151/m151 mutant embryos labelled with membrane-NeonGreen mRNA (D), and Tg(βActin:membrane-Citrine) embryos injected with control morpholino (MO) and has3-specific MO-1 (E). Buds in controls are marked by asterisk (white, yellow and cyan for lateral, anterior and posterior buds respectively). Genetically perturbed embryos have no buds. Anterior to the left and DL into the plane of view. Scale bar, 50 μm. (F) Individual data points and mean±standard deviation (s.d.) of bud lengths in controls and genetic perturbations at 54 hpf. In the absence of buds, bud lengths correspond to cell lengths. ‘n’ denotes the number of buds measured per condition. p values as labelled (Mann Whitney- U test). |

The ECM of the buds is rich in hyaluronan and dense
(A-D) 3D rendered OVs showing HA, F-actin and Collagen 2 staining using HA-Binding Protein (HABP), Phalloidin and Anti-Col2a1a respectively, at select time points in uninjected (A-C) and hyaluronidase (HAase) treated embryos (D). Anterior to the left and DL into the plane of view. The contrast of each time point is individually set to capture the dynamic range of HABP. Insets show 2D sections of the antero-lateral buds. Scale bar, 50 μm. ‘n’ denotes the number of buds. (E) Mean intensities±s.e. of various stains across the illustrated ROI in the lateral buds at 48 hpf. (F-H) 2D sections showing percolation of dextran from the periotic space into the bud-ECM 2 hours post injection (hpi). Different sizes of Texas-red dextran (in magenta)-3 kDa (F), 10 kDa (G) and 70 kDa (H) with approximate Stokes radii 1 nm, 2 nm and 5 nm respectively, were co-injected with aBt (green) in Tg(βActin:membrane-citrine) embryos (blue). aBt colocalizes with all three sizes of dextran in the periotic space (white). Contrast is same across embryos. Scale bar, 50 μm. (I) Individual data points and mean±s.e. of fluorescent intensities of different sizes of dextran in the bud ECM normalized to their intensities in the periotic space. ‘n’ denotes the number of buds per condition. p values as labelled (Mann Whitney- U test). (HJ) Mean±s.e. of the normalized fluorescent intensities of different sizes of dextran and HABP in the bud ECM from the base to the tip (as show in the illustration Figure S3C). ‘n’ denotes the number of buds per condition. |

Hyaluronate drives tissue and cellular morphogenesis through isotropic pressure
(A and B) Composite of 2D sections of representative examples from controls (A) and HAase injected (B) embryos at 0 and 4 hours post injection (hpi) using Tg(βActin:membrane-Citrine) (green) and Texas-red dextran (magenta) in the periotic space. Lateral, anterior and posterior buds from different z-depths are framed in white, yellow and cyan respectively. Scale bar, 50 μm. (C) Individual data points and mean±s.d. of bud-ECM and cell volume across time. Each data point for cell volume is an average from 6 cells in a bud. ‘n’ denotes the number of buds per condition. p values as labelled (Mann Whitney- U test). (D and E) Bud-ECM volume (D) and bud lengths (E) in control and HAase injected embryos at 0 and 4 hpi. In the absence of buds, lengths correspond to cell lengths. ‘n’ denotes the number of bud-ECMs or buds respectively. p values as labelled (Mann Whitney- U test). (F) Illustration showing the longitudinal (blue), circumferential (orange) and radial (black) axes of cells during budding. Deposition of HA in the bud-ECM is shown in purple. Cyan arrows show hydrostatic pressure from HA swelling. Notice the change in aspect ratio of the cells before and after HA-swelling. (G) Side and transverse sections of an anterior bud from an uninjected embryo at select time points, and HAase treated embryo at 54 hpf, using Tg(βActin:membrane-Citrine). Dotted line in side view (xy) marks the y position for transverse view (xz). Scale bar, 10 μm. (H) Individual data points and mean±s.d. of cell diameters across time (hours post budding, hpb). *denotes p=0.03 (Mann Whitney- U test). Each data point is an average from 6 cells per bud. ‘n’ denotes the number of buds. (I) Individual data points and mean±s.d. of cell diameters in HAase-treated embryos at 0 and 4 hpi. Each data point is the diameter of a single cell. ‘n’ denotes the number of cells. p values as labelled (Mann Whitney- U test). (J) Illustration showing the longitudinal (Rl) and circumferential radius (RC) of the bud. (K) Individual data points and mean±s.d. of bud radii across time. ‘n’ denotes the number of buds. |

Adhesive and tension-rich membrane tethers resist hyaluronate-pressure
(A) 2D sections of an anterior bud showing cells (1, 2 and 3) engaged in a tether (red arrow) that eventually breaks and retracts. Scale bar, 10 μm. (B) Two-dimensional (2D) and three-dimensional (3D) views of segmented cells showing membrane tether between cells 1,2 and 3 using side and transverse sections. (C) 2D sections of a lateral bud showing cells (1, 2 and 3) engaged in a tether (red arrow) using mosaic membrane labelling in red and Myosin II (black) reporter. Scale bar, 10 μm. (D) 2D section of an anterior bud showing accumulation of E-Cadherin (black) on the lateral membrane (blue arrows) and in the tether between cells 1 and 2 (red arrow) (E) Side and transverse views of 2D sections showing tethered and unmembrane tether retraction with membrane labelling. The cell forming an unmembrane tether (top) is marked with an asterisk. The cells forming membrane tethers (bottom) are tracked with numbers 1 and 2. Adjacent membrane angles and adjacent cell distance are shown in blue and red before and after retraction respectively. Scale bar, 10 μm. (F) Adjacent membrane angles (G) and cell distance (H) before and after retraction. ‘n’ denotes the number of cells. p values as labelled (Mann Whitney- U test). (G)Left: 2D sections of lateral buds from controls (top) and HAase (bottom) injected embryos using Tg(βActin:membrane-Citrine) and Texas-red dextran in the periotic space. Membrane tethers (marked by white arrow) retract in control (top) but not in HAase treated embryo (bottom). Scale bar, 10 μm. Right: Individual data points and mean±s.d. of the duration of membrane tethers in control and HAase-treated embryos. n denotes the number of tethers. p values as labelled (Mann Whitney- U test). (H) Left: 2D sections of anterior buds from controls (top) and DN E-Cadherin (bottom) expressing embryos using Tg(βActin:membrane-Citrine). Membrane tether (marked by white arrow) is present in control (top) but not in perturbed embryo (bottom). Scale bar, 10 μm. Right: Individual data points and mean±s.d. of the number of membrane tethers in control and DN E-cad mutant expressing embryos. n denotes the number of buds. p values as labelled (Mann Whitney- U test). |

Anisotropic distribution of cytocinches drives bud-to-tube transition
(A) Individual data points and mean±s.d. of the number of tethers per bud (left axis, purple) and the number of cytocinches per cell (right axis, gray) at given time points. ‘n’ denotes the number of buds. p values as labelled (Mann Whitney- U test). (B) Individual data points, mean± s.d. and violin plot of cytocinch tether orientation measured with respect to (w.r.t) the longitudinal bud axis at given time points. ‘n’ denotes the number of tethers. p values as labelled (Mann Whitney- U test). (C) Bud aspect ratio plotted as a function of cytocinch anisotropy (number*orientation) at different stages. Grey line is a linear fit with R2=0.96. (D) Schematic of the 2D vertex model with apical, lateral and basal surface tension, enclosing a prescribed bud-ECM volume, with addition of inward forces from circumferential cytocinches (Λ). (E) Equilibrium configurations of a bud section, using the 2D vertex model (n=10 cells, grey arrows for basal, lateral and apical surfaces and green dots for cytocinches) at 1 hpb (Λ=0) and 9 hpb (Λ=0.8/cytocinch). (F) Predicted evolution of bud radii in the long (blue) and short (orange) axes (experimental: big dots, predictions: little dots) assuming the experimentally observed increase of bud-ECM volume and cytocinch fraction in time. (G) 2D vertex model configuration with (Λ=0.8) and without (Λ=0) cytocinches. (H) 2D sections of an anterior bud at 6 hpb using Myosin II reporter before and after Cytochalasin D (CytoD 1mM) treatment. Cytocinch is marked by white arrow before treatment. Cytocinch is lost after CytoD treatment. Before (blue) and after (red) circumferential bud diameter is labelled. (I and J) Number of cytocinch tethers per bud (I), bud radii and aspect ratios (J) before and after CytoD treatment. ‘n’ denotes the number of buds. p values as labelled (Mann Whitney- U test). (K) Illustration of the mechanism underlying budding morphogenesis for SCC formation. Patterned cells in the OV (in orange) synthesize HA. HA drives budding through isotropic extracellular forces (in purple). Anisotropic resistance from cytocinches (in green) mediate anisotropic bud extension. |
Reprinted from Cell, 184, Munjal, A., Hannezo, E., Tsai, T.Y., Mitchison, T.J., Megason, S.G., Extracellular hyaluronate pressure shaped by cellular tethers drives tissue morphogenesis, 6313-6325.e18, Copyright (2021) with permission from Elsevier. Full text @ Cell