
- Title
-
Tetraspanin Cd9b and Cxcl12a/Cxcr4b have a synergistic effect on the control of collective cell migration
- Authors
- Marsay, K.S., Greaves, S., Mahabaleshwar, H., Ho, C.M., Roehl, H., Monk, P.N., Carney, T.J., Partridge, L.J.
- Source
- Full text @ PLoS One
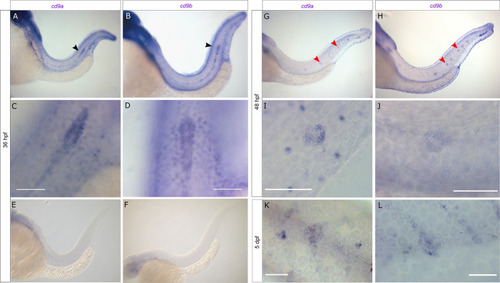
cd9a and cd9b are expressed in the pLLP during zebrafish development.
A-F: Micrographs of WISH of cd9a and cd9b at 36 hpf with sense and anti-sense probes. (a-b) Overview shows staining in pLL; (c-d) higher resolution images show expression in the primordium; (e-f) sense probes show no staining. G-J: WISH of cd9a and cd9b at 48 hpf; (g-h) overview shows staining in pLL; (i-j) higher resolution images show expression in a neuromast. K-L: WISH of cd9a and cd9b at 5 dpf in a neuromast. Arrows indicate primordium (black) and neuromasts (red). Scale bar indicates 50 μm (white). |
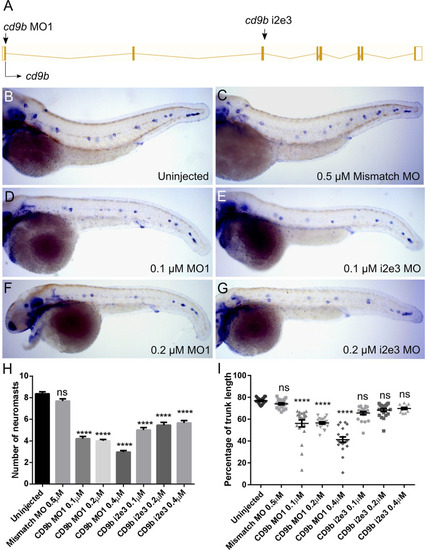
cd9b MO caused a decrease in neuromasts deposited at 52 hpf.
A: Intron exon diagram of the cd9b gene with MO target sites. B-G: Representative images of WISH of claudin b at 52 hpf of (b) uninjected embryos, (c) embryos with 0.5 μM Mismatch, (d) 0.1 μM cd9b MO1, (e) 0.1 μM cd9b i2e3 MO1, (f) 0.2 μM cd9b MO1, (g) 0.2 μM cd9b i2e3 MO. H: Graph showing the number of neuromasts deposited at 52 hpf is significantly decreased after injection with both cd9b MO1 and cd9b i2e3 MO, with as low as 0.1 μM MO. I: Graph showing the percentage of trunk between the first and last deposited neuromast is decreased in cd9b MO1 morphants but not cd9b i2e3 morphants. ANOVA with Dunnett’s multiple comparisons test was used. n = minimum 12 lateral lines analysed per condition. ****p = <0.05. |
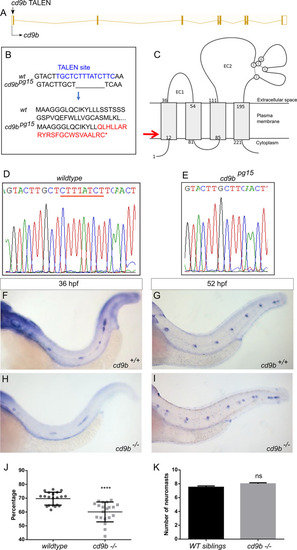
cd9b mutant does not recapitulate morphant phenotype, although primordium migration is delayed at 36 hpf.
A: Nature of the cd9b mutant allele showing TALEN site location within the intron-exon structure of the gene. B: The TALEN target sequence in exon 1 is shown in blue; the 8bp deletion in the cd9b allele is indicated under the WT sequence as dashes. This leads to a frameshift changing codon 15 from TTT (Phe) to CAA (Glu), then 22 aberrant amino acids (red lettering) followed by a stop codon (*). C: Schematic of the Cd9b protein with location of premature stop codon given by red arrow. The disulfide bonds between the conserved CCG motif and conserved cysteines are indicated by the dashed lines. EC1/2 = Extracellular domain 1/2, aa = amino acid. D-E: Sequence chromatograms of genomic DNA from (d) WT and (e) cd9bpg15 alleles. Deleted base pairs are underlined in red. F-I: Representative images of WISH of claudin b ISH on (f-g) WT and (h-i) cd9b mutants at time shown. J-K: Graphs quantifying pLLP measurements in WT and cd9b KOs; (j) the migration of the cd9b KO primordium at 36 hpf is significantly delayed compared to WT. (k) There is no significance in number of neuromasts deposited at 52 hpf. Unpaired T test on untransformed data. n = minimum 20. **** = p = <0.05. |

Generation of cd9a mutant does not show any abnormal pLLP development.
A: Nature of the cd9a mutant allele showing CRISPR site location within the intron-exon structure of the gene. B: The CRISPR target sequence in exon 3 is shown in blue; the 2bp deletion in the cd9a allele is indicated under the WT sequence as dashes. This leads to a frameshift changing codon 62 from ATT (Iso) to TGC (Cys), then 54 aberrant amino acids (red lettering) followed by a stop codon. C: Schematic of the Cd9a protein with location of premature stop codon, indicated by red arrow, at a predicted 115 aa. EC1/2 = Extracellular domain 1/2 D-E: Sequence chromatograms of genomic DNA from (d) WT and (e) cd9aic62 allele. Deleted base pairs are underlined in red. F-G: claudin b expression in WT at (f) 30 hpf and (g) 48 hpf. H-I: claudin b expression in cd9a mutants at (h) 30 hpf and (i) 48 hpf. J-K: Graphs quantifying pLLP measurements in WT and cd9a KOs; (j) migration of the cd9a KO primordium at 36 hpf is similar to WT. (k) There is no significance in number of neuromasts deposited. Significance was assessed using an unpaired t test. N = minimum 7. Bars show mean +/- SD. |
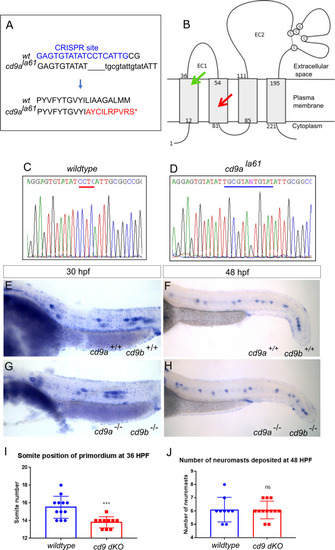
Generation of cd9a mutant in the cd9b pg15 KO background to create a double cd9 KO mutant.
A: cd9a mutant allele sequence from exon 3, showing CRISPR target sequence in blue. The 4bp deletion (dashes) and 12bp insertion (lowercase) results in an 8bp insertion as indicated under the WT sequence. This leads to a frameshift changing codon 61 from CTC (Leu) to GCG (Ala), then 9 aberrant amino acids (red lettering) followed by a stop codon. B: Schematic of the Cd9 protein with location of premature stop codon for Cd9a (red arrow) and Cd9b (green arrow) at a predicted 70 aa and 36 aa respectively. EC1/2 = Extracellular domain 1/2. C-D: Sequence chromatograms of genomic DNA from (c) WT and (d) cd9ala61 allele. Deleted base pairs are underlined in red and inserted base pairs in blue. E-F: claudin b expression in WT at (e) 30 hpf and (f) 48 hpf. G-H: claudin b expression in cd9 dKO mutants at (g) 30 hpf and (h) 48 hpf. I-J: Graphs showing pLLP measurements in WT and cd9 dKOs; (i) migration of the cd9 dKO primordium at 36 hpf is significantly delayed compared to WT. (j) There is no significance in number of neuromasts deposited. Significance was assessed using an unpaired t test. N = minimum 9, p = <0.001, n1 = neuromast 1 etc. Bars show mean +/- SD. |

Primordium organisation appears normal in cd9 dKO(cldnb:gfp) embryos from 30 hpf.
A-B: Still images from a time-lapse recording of a migrating primordium in (a) WT and (b) cd9 dKOs. 0 minutes shows initial deposition as a proneuromast becomes distinct from the primordium and then 2 sequential images show (a’-b’) 20 minutes and (a’’-b’’) 60 minutes later. In the primordium of both WT and cd9 dKOs, filopodia can be seen at the leading edge (white arrow) and the formation of rosettes in the trailing edge (white dashed circle). Representative images from two videos that included two depositions each. Scale bar: 20 μm. |
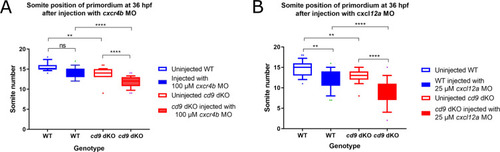
cxcr4b and cxcl12a MOs further delay primordium migration at 36 hpf in cd9 dKO embryos.
A-B: Distance migrated by the primordium (labelled by claudin b ISH) were recorded for (a) injection of 100 μM cxcr4b MO, and (b) 25 μM cxcl12a MO. Significance was assessed using one-way ANOVA, * = p<0.05, ** = p<0.01, *** = p<0.001 **** = p<0.0001. N = minimum 15. Box extends from the 25th to 75th percentile and whiskers from 10th to 90th. |