
- Title
-
Cadherin-12 Regulates Neurite Outgrowth Through the PKA/Rac1/Cdc42 Pathway in Cortical Neurons
- Authors
- Guo, B., Qi, M., Huang, S., Zhuo, R., Zhang, W., Zhang, Y., Xu, M., Liu, M., Guan, T., Liu, Y.
- Source
- Full text @ Front Cell Dev Biol
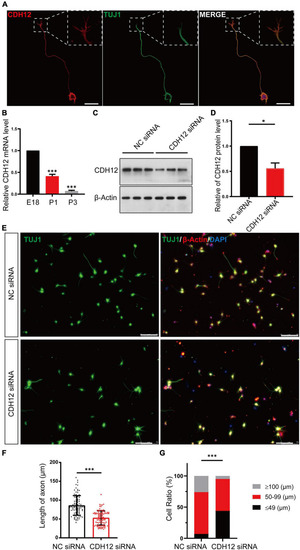
CDH12 knockdown decreased neurite outgrowth in E18 neurons. (A) Representative images of immunofluorescence staining showing the expression of CDH12 in the cell membrane of the cell body, axon, and growth cone. The white dashed box shows an enlarged view of the growth cone. The scale bar represents 25 μm. (B) The mRNA level of CDH12 in cortical neurons decreased gradually with development (E18, P1, P3) as detected using real-time PCR. The level of CDH12 mRNA in E18 neurons was normalized as 1. The data were shown as mean ± SE, n = 3, ∗∗∗P < 0.001. Western blotting (C) and statistical (D) results showing the effectiveness of small interfering RNA in knocking down CDH12 expression. β-actin was used as a loading control. The value of CDH12/β-actin in NC siRNA treatment was normalized as 1. The data were shown as mean ± SE, n = 3, ∗P < 0.05. (E,F) CDH12 knockdown significantly decreased axon growth in E18 neurons after CDH12 siRNA treatment for 36 h. The scale bar represents 75 μm. The data were shown as mean ± SD, n = 96, ∗∗∗P < 0.001. (G) The ratio of neuronal development (with different axonal lengths) was affected by CDH12 knockdown. n = 100, ∗∗∗P < 0.001 (two-way ANOVA). |

RNA sequencing and DEG analysis of E18 cortical neurons with or without CDH12 knockdown. (A) Volcano map of DEGs between two groups of cortical neurons. A total of 32 and 17 genes were significantly upregulated (red dots) and downregulated (blue dots) after CDH12 knockdown, respectively. (B) Hierarchical clustering analysis of DEGs of cortical neurons with or without CDH12 knockdown treatment. (C) The top 20 enriched GO terms of the 49 DEGs. CC: cellular component, MF: Molecular function, BP: Biological process. (D) The most significantly enriched KEGG pathways of the downregulated genes. The top three enriched pathways of “Environmental Information Processing” are Cell adhesion molecules (CAMs), cAMP pathway, and MAPK pathway. |
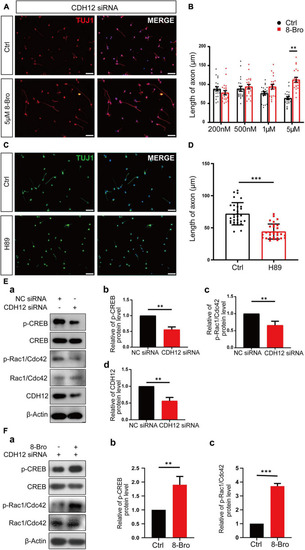
CDH12 regulates neuronal growth via the PKA/Rac1/Cdc42 pathway. (A,B) PKA agonist (8-Bro) could rescue the CDH12 knockdown phenotype when its concentration reached 5 μM. The scale bar represents 75 μm. The statistical data show the mean ± SE. n = 20, ∗∗P < 0.01. (C) Representative images of Tuj1 immunostaining in neurons treated with control (Ctrl) or H89 (3 μM) for 12 h. The scale bar represents 75 μm. (D) The statistical result of axonal length after treatment with the negative control or H89 (3 μM) in E18 neurons. The data shown are the mean ± SE. n = 30, ∗∗∗P < 0.001. (E) CDH12 regulates neuronal growth via the PKA/Rac1/Cdc42 pathway. (a) Representative western blotting results show the levels of p-CREB and p-Rac1/Cdc42 proteins with or without CDH12 knockdown. (b) Statistical result (mean ± SE) of relative p-CREB levels. The value of p-CREB/total CREB in the control treatment was normalized as 1. (c) Statistical result (mean ± SE) of relative p-Rac1/Cdc42 levels. The value of p-Rac1/Cdc42/total Rac1/Cdc42 in the control treatment was normalized as 1. Panel d. Statistical result (mean ± SE) of relative CDH12 levels. The value of CDH12/β-Actin in the control treatment was normalized as 1. n = 3, ∗∗P < 0.01. (F) CDH12 siRNA-mediated inhibition of the Rac1/Cdc42 pathway is rescued by 8-Bro. (a) Representative western blotting results show the levels of p-CREB and p-Rac1/Cdc42 proteins with or without 8-Bro treatment. (b) Statistical results (mean ± SE) of relative p-CREB levels. The value of p-CREB/total CREB in the control treatment was normalized as 1. (c) Statistical results (mean ± SE) of relative p-Rac1/Cdc42 levels. The value of p-Rac1/Cdc42/total Rac1/Cdc42 in the control treatment was normalized as 1. The statistical significance of the difference was determined using ANOVA (∗∗∗P < 0.001, ∗∗P < 0.01 vs. control). |
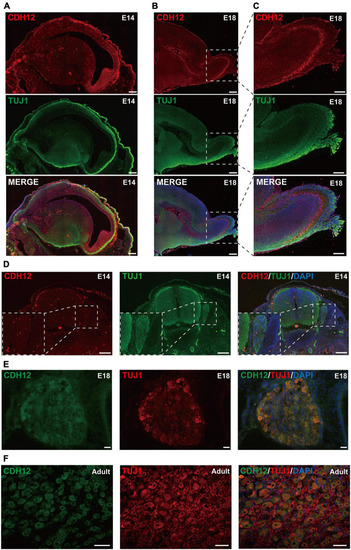
Expression pattern of CDH12 during development. (A) CDH12 is widely expressed in the E14 brain. Sagittal sections of the E14 rat brain were stained with antibodies against CDH12 and Tuj1. The scale bar represents 500 μm. (B) High expression of CDH12 was observed in the olfactory bulb of E18 rats. Immunostaining images of sagittal brain sections were obtained by staining with antibodies against CDH12 and tubulin. The scale bar represents 500 μm. (C) Enlarged view of the boxed area in panel B. The scale bar represents 250 μm. (D) Representative images of the immunofluorescence staining of CDH12 expression in the E14 spinal cord and DRG. The expression of CDH12 is limited at this development stage. The white dashed box shows an enlarged view of the DRG. The scale bar represents 200 μm. (E,F) Representative images of the immunofluorescence staining of CDH12 expression in the E18 and adult rat DRG, respectively. CDH12 expression is upregulated in the DRG during development. The scale bar represents 50 μm. |

Knockdown of CDH12 shortens the length of axons in zebrafish caudal primary (Cap) neurons. (A) In situ hybridization showing the expression patterns of CDH12 in zebrafish embryos at 24 hpf. CDH12 expression is mainly observed in the hindbrain and the spinal cord. (B) Schematic diagram of CDH12 gDNA-induced NgAgo knockdown. (C) Fluorescence images of Cap neurons after NgAgo-mediated CDH12 knockdown for 18 h. White dotted lines indicate the body parts of zebrafish Cap neurons, and a “∗” represents the absence of axons. The scale bar represents 50 μm. (D) The efficiency of CDH12 NgAgo treatment as determined via the qRT-PCR assay. The data are presented as the mean ± SE, n = 3, ∗P < 0.05. (E) Statistical results of the axon length of Cap neurons after CDH12 knockdown in zebrafish embryos for 12 h. The data are presented as the mean ± SE, n = 20, ∗P < 0.05. (F) Fluorescence images of NgAgo-mediated CDH12 knockdown in zebrafish (HB9) for 48 h. The scale bar represents 50 μm. (G) The knockdown efficiency carried out by NgAgo treatment was further improved. The data are presented as the mean ± SE, n = 3, ∗∗P < 0.01. (H) The extension of axons was similarly inhibited by CDH12 knockdown for 48 h. The data are presented as the mean ± SE, n = 20, ∗P < 0.05. |