
|
FIGURE 2
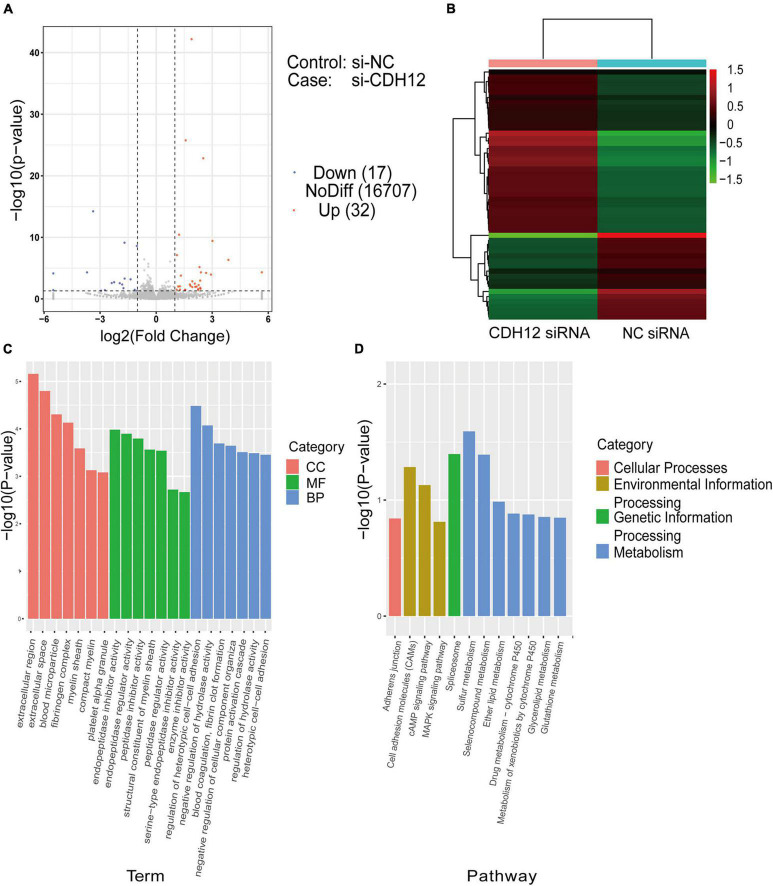
RNA sequencing and DEG analysis of E18 cortical neurons with or without CDH12 knockdown. (A) Volcano map of DEGs between two groups of cortical neurons. A total of 32 and 17 genes were significantly upregulated (red dots) and downregulated (blue dots) after CDH12 knockdown, respectively. (B) Hierarchical clustering analysis of DEGs of cortical neurons with or without CDH12 knockdown treatment. (C) The top 20 enriched GO terms of the 49 DEGs. CC: cellular component, MF: Molecular function, BP: Biological process. (D) The most significantly enriched KEGG pathways of the downregulated genes. The top three enriched pathways of “Environmental Information Processing” are Cell adhesion molecules (CAMs), cAMP pathway, and MAPK pathway.