
- Title
-
Identification of astroglia-like cardiac nexus glia that are critical regulators of cardiac development and function
- Authors
- Kikel-Coury, N.L., Brandt, J.P., Correia, I.A., O'Dea, M.R., DeSantis, D.F., Sterling, F., Vaughan, K., Ozcebe, G., Zorlutuna, P., Smith, C.J.
- Source
- Full text @ PLoS Biol.
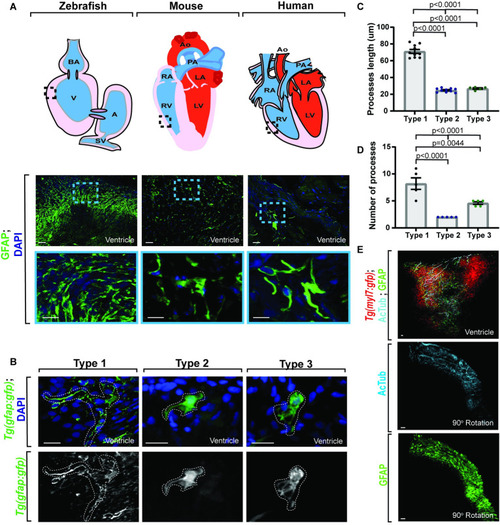
Adult gfap+ cells are conserved across species.
(A) Confocal maximum z-projection from adult zebrafish, mouse, and human ventricle stained with GFAP. Schematics of hearts per species (above) indicate location of imaging. Gfap+ cells are present across species. (B) Confocal 10 μm z-projection of adult Tg(gfap:gfp) ventricles with 3 distinct morphologies of gfap+ cells. (C) Quantification of process length between gfap+ cell types. (D) Quantification of process number per gfap+ cell type. (E) Confocal maximum z-projection from adult Tg(myl7:gfp) ventricles stained with AcTub and GFAP showing localization. Gfap+ cells localize with AcTub+ axons. Data are represented as mean ± SEM. Scale bar equals 10 μm. Statistics summarized in S1 Table. See S1 Data for raw data. A, atrium; AcTub, acetylated tubulin; AO, aorta; BA, bulbous arteriosus; LA, left atrium; LV, left ventricle; PA, pulmonary artery; RA, right atrium; RV, right ventricle; SV, sinoatrial valve; V, ventricle. EXPRESSION / LABELING:
|

gfap+ cells express the astroglial gene slc1a3b but not cardiomyocyte genes.
(A) Confocal 20 μm z-projection of 6 dpf Tg(gfap:nucGFP);Tg(slc1a3b:myrGcAMP6-P2A-H2AmCherry) ventricle stained with GFP. GFP+ cells (white arrowhead) colocalize with H2AmCherry+ cells (white arrow). (B) Confocal 20 μm z-projection of 6 dpf Tg(gfap:nucGFP) ventricle injected with slc1a3b:nls-tdTomato. nucGFP+ cells (white arrowheads) colocalize with tdTomato+ cells (white arrows). (C) Confocal 20 μm z-projection of 6 dpf Tg(gfap:nucGFP) ventricle stained with glutamine synthetase. nucGFP+ cells (white arrowheads) colocalize with glutamine synthetase+ cells (white arrows). (D) Quantification of the percentage of gfap:nucGFP+ cells that express slc1a3b:nls-tdTomato (n = 124 cells) or GS (n = 76 cells). (E) Quantification of the percentage of slc1a3b:nls-tdTomato+ (n = 115 cells) or GS+ (n = 15 cells) cells that express gfap:nucGFP. (F) Confocal 10 μm z-projection of a 6-dpf Tg(slc1a3b:myrGFP-P2A-H2AmCherry)+ cell morphology. (G, H) Confocal 20 μm z-projections of (G) 6 dpf Tg(gfap:nucGFP) ventricle and (H) adult Tg(gfap:nucGFP) ventricle stained with Mef-2A. The nucGFP+ cells (white arrowhead) do not colocalize with Mef-2A puncta. Inlet area is denoted by white dotted box. (I) Quantification of percentage of gfap:nucGFP+/Mef-2A+ cells per 6 dpf (n = 211 cells) and adult ventricles (n = 49 cells). (J) Confocal 10 μm z-projection of adult Tg(gfap:gfp) ventricles stained with MBP and AcTub. MBP (white arrow) does not colocalize to gfap+ cells (white arrowhead). Inlet areas are denoted by white box. Data are represented as mean ± SEM. Scale bar equals 10 μm. Statistics summarized in S1 Table. See S1 Data for raw data. AcTub, acetylated tubulin; dpf, days postfertilization; GS, glutamine synthetase; MBP, myelin basic protein; V, ventricle. |

Adult gfap+ cells localize with neurons and synapses and impact neuronal development.
(A) Confocal 10 μm z-projection from adult Tg(gfap:gfp) heart stained with AcTub. Axons have primary (white arrowhead), secondary (purple arrowhead), and tertiary (gray arrowhead) branches. (B) Quantification of colocalization between primary, secondary, and tertiary branches of axons and gfap+ cells. (C) Top: confocal 10 μm z-projection of adult Tg(gfap:gfp) heart stained with AcTub and rotated 90°. Bottom: 3D rendering of the AcTub and GFAP (white dotted box) are presented below. The gfap+ cells associate with axons (white arrowheads). (D) Representative quantification of intensity over distance of AcTub and GFAP. (E) Top: confocal maximum z-projection of adult Tg(gfap:gfp) ventricles stained with SV2 or Synaptotagmin. Bottom: 90°-rotated 3D rendering of contact points (white arrowheads) between GFAP and SV2 or Synaptotagmin. (F) Quantification of Tg(gfap:nsfb-mCherry+) intensity in the heart or retina (location control) after injection of DMSO or MTZ. (G) Quantification of axonal number after MTZ or full laser ablation of nucGFP+ cells. (H) Confocal maximum z-projection of ventricle (white dotted outline) of 6 dpf Tg(gfap:nucGFP) with either MTZ injection or full laser ablation of nucGFP+ cells and stained with AcTub. Arrows indicate increased innervation and arrowheads indicate nucGFP+ cells. Data are represented as mean ± SEM. Scale bar equals 10 μm. Statistics summarized in S1 Table. See S1 Data for raw data. AcTub, acetylated tubulin; dpf, days postfertilization; MTZ, metronidazole; V, ventricle. |

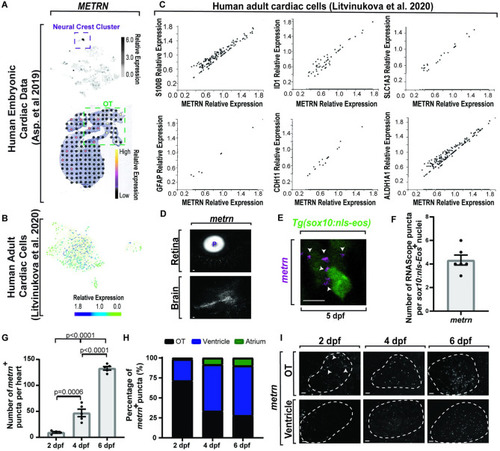
CNG originate from the neural crest and develop in the heart by 4 dpf.
(A) Schematic of embryonic heart showing the BA (green), ventricle (cyan), atrium (dark blue), AVN, and SAN. Blood flows unidirectionally (gray dotted arrow). (B) Confocal maximum z-projections of heart (white dotted outline) at 4, 5, 6 dpf, and 2 mpf Tg(gfap:nucGFP) stained with AcTub. nucGFP+ cells (white arrowheads) increase over time. (C) Quantification of Tg(gfap:nucGFP)+ cell number over time. (D) Quantification of Tg(gfap:nucGFP)+ spatiotemporal location from 4–6 dpf. (E) Quantification of Tg(slc1a3b:myrGFP-P2A-H2AmCherry)+ cell number over time. (F) Quantification of Tg(slc1a3b:myrGFP-P2A-H2AmCherry)+ spatiotemporal location from 4–6 dpf. (G) Confocal maximum z-projection of a 24-hour time-lapse starting at 24 hpf in Tg(sox10:nls-eos) with migration path. Anterior neural crest cells migrate to both the outflow and inflow tract (white dotted outline). (H) Schematic of hindbrain photoconversion in Tg(sox10:nls-eos) embryos. Photoconverted cells are indicated by blue dots. (I) Confocal maximum z-projection of a 24-hour time-lapse starting at 24 hpf in Tg(sox10:nls-eos) with hindbrain neural crest photoconversion (PC). Photoconverted Eos+ cells (white arrowheads) are found throughout the heart. (J) Quantification of percentage of Eos+ cells with a hindbrain neural crest origin. (K) Confocal maximum z-projection of 5 dpf Tg(sox10:nls-eos);Tg(gfap:nucGFP) hearts that are photoconverted in the hindbrain at 24 hpf and stained with GFP at 5 dpf. All GFP+ cells coexpress photoconverted Eos (white arrowheads). (L) Quantification of percentage of GFP+ cells that coexpress photoconverted Eos at 5 dpf. (M) Quantification of number of GFP+ cells at 6 dpf after either hindbrain or trunk neural crest ablation. Data are represented as mean ± SEM. Scale bar equals 10 μm. Statistics summarized in S1 Table. See S1 Data for raw data. AcTub, acetylated tubulin; AVN, atrioventricular node; BA, bulbous arteriosus; CNG, cardiac nexus glia; dpf, days postfertilization; hpf, hours postfertilization; mpf, months postfertilization; OT, outflow tract; R, retina; SAN, sinoatrial node; V, ventricle. EXPRESSION / LABELING:
|
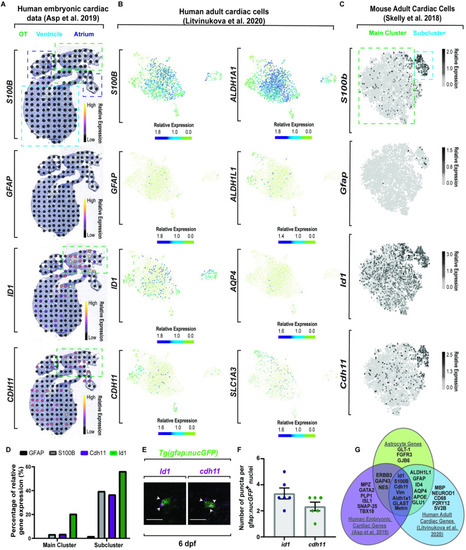
Molecular dissection of astroglia genes in the heart across species. (A) Spatiotemporal sequencing [64] of human embryonic hearts. Developmental astrocyte-associated genes are expressed. Dot color denotes relative transcript expression based on raw reads per spot. (B) Single-cell sequencing [65] from the neuronal cluster of human adult hearts. Scale bar denotes relative gene expression. (C) Single-cell sequencing [66] of astrocyte genes in the fibroblast cluster from adult mouse tissue. Scale bar denotes relative gene expression. (D) Quantification of published adult mouse single-cell sequencing [66] from the fibroblast cluster indicates a conserved subcluster with astrocyte gene up-regulation. (E) Confocal z-section of 6 dpf Tg(gfap:nucGFP) zebrafish embryos with id1 or cdh11 RNAScope. id1/cdh11+ puncta (white arrowheads) localize to nucGFP+ cells. (F) Quantification of id1 and cdh11 RNAScope puncta per cell. (G) Venn diagram of published sequencing data from human embryonic hearts [64], human adult heart [65], and classic astrocyte genes. Data are represented as mean ± SEM. Scale bar equals 10 μm. Statistics summarized in S1 Table. See S1 Data for raw data. dpf, days postfertilization; OT, outflow tract. EXPRESSION / LABELING:
|
(A) Top: single-cell sequencing of |

(A) Schematic representation of PHENOTYPE:
|

CNG regulate heart rate and rhythm.
(A) Quantification of the number of ventricular contractions (bpm) at 6 dpf after various gfap+ ablation techniques. (B) Quantification of percent duration of ventricular fibrillation in metrn−/− animals and Tg(gfap:nucGFP) animals with full laser ablation of nucGFP+ cells. (C) Representative graphs of ventricular blood flow intensity (au) over time in wild-type animals. (D) Representative graphs of ventricular blood flow intensity (au) over time in metrn+/− animals. (E) Representative graphs of ventricular blood flow intensity (au) over time in metrn−/− animals. (F) Schematic of gfap+ ablation by location. Green dots denote gfap+ cells. Lightning denotes ablation. (G) Quantification of number of ventricular contractions at 6 dpf after ablation of gfap+ by location. Data are represented as mean ± SEM. Statistics summarized in S1 Table. See S1 Data for raw data. A, atrium; bpm, beats per minute; CNG, cardiac nexus glia; dpf, days postfertilization; MTZ, metronidazole; OT, outflow tract; V, ventricle. PHENOTYPE:
|
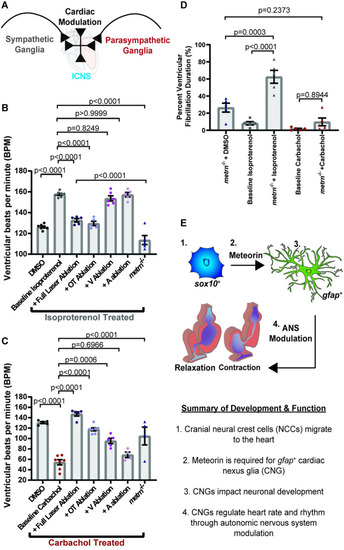
CNG control heart function through sympathetic/parasympathetic modulation.
(A) Schematic of sympathetic and parasympathetic regulation of cardiac function through communication with the ICNS. (B) Quantification of the number of ventricular contractions with sympathetic agonist (isoproterenol) treatment over various location ablation of nucGFP+ cells. (C) Quantification of the number of ventricular contractions with parasympathetic agonist (carbachol) treatment over various location ablation of nucGFP+ cells. (D) Quantification of percent duration of ventricular fibrillation in metrn−/− animals after treatment with the isoproterenol or carbachol. (E) Schematic of overall findings of CNG showing that they originate from the neural crest and require metrn to generate gfap+ cells that control heart rate and rhythm. Data are represented as mean ± SEM. Statistics summarized in S1 Table. See S1 Data for raw data. A, atrium; ANS, autonomic nervous system; bpm, beats per minute; CNG, cardiac nexus glia; ICNS, intracardiac nervous system; OT, outflow tract; V, ventricle. PHENOTYPE:
|