
- Title
-
Stabilized fermentation product of Cetobacterium somerae improves gut and liver health and antiviral immunity of zebrafish
- Authors
- Xie, M., Xie, Y., Li, Y., Zhou, W., Zhang, Z., Yang, Y., Olsen, R.E., Ringø, E., Ran, C., Zhou, Z.
- Source
- Full text @ Fish Shellfish Immunol.
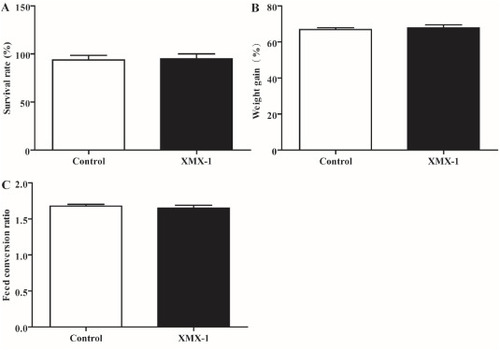
Fig. 1. Effects of XMX-1 diet on the survival rate, weight gain (%) and feed conversion ratio. (A) Survival rate (%), (B) weight gain (%), (C) feed conversion ratio. Data were represented as the means (±SEM) (n = 6). |
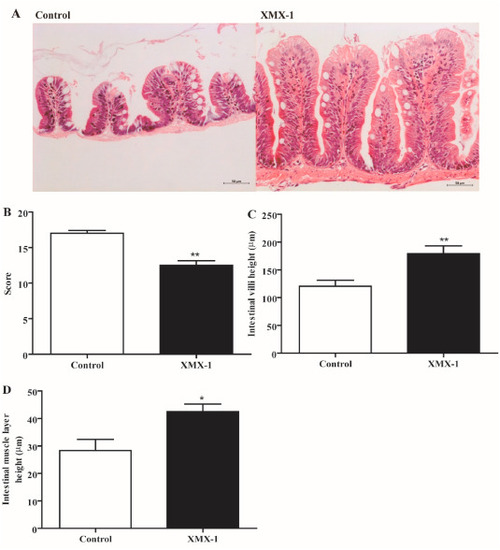
Fig. 2. Effects of dietary control and XMX-1 on intestinal morphology of zebrafish (A) Representative intestinal histology image by H&E staining. The scale bar is 50 μm. (B) Histological score of gut, (C) Score of intestinal villi height, (D) Score of intestinal muscle layer. Data were represented as the means (±SEM) (n = 6). *, p < 0.05 and **, p < 0.01 comparison to the control group. |
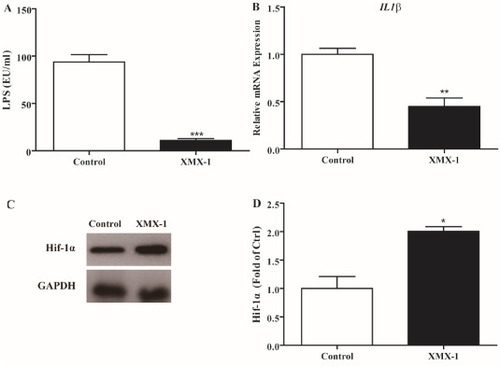
Fig. 3. Effects of XMX-1 diet on the level of serum LPS, the expression of IL-1β and western blot analysis of Hif-1α in intestine (A) LPS, (B) IL-1β, (C, D) Western blot analysis of Hif-1α. Data were represented as the means (±SEM) (n = 6). *, p < 0.05, **, p < 0.01 and ***, p < 0.0001 comparison to the control group. |
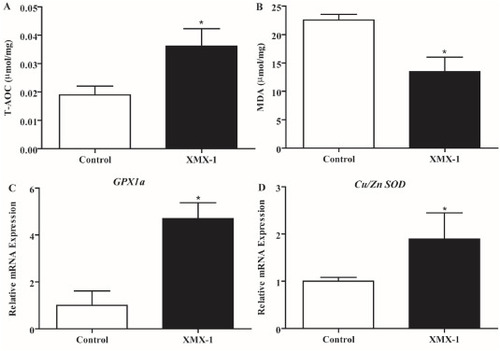
Fig. 4. Effects of XMX-1 diet on the level of T-AOC, MDA and the expression of GPX1α and Cu/Zn SOD in intestine (A) T-AOC, (B) MDA, (C) GPX1α, (D) Cu/Zn SOD. Data were represented as the means (±SEM) (n = 6). *, p < 0.05 comparison to the control group. |
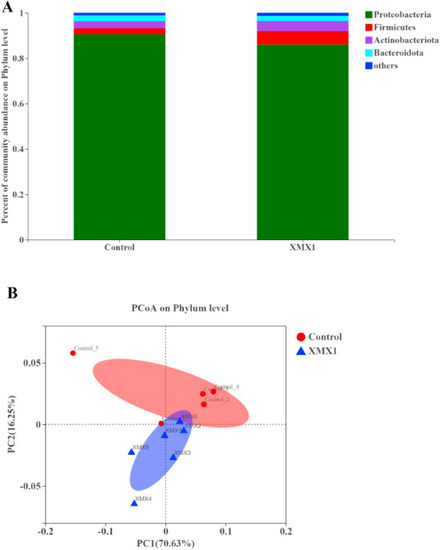
Fig. 5. Effects of dietary XMX-1 fermentation product on the gut microbiota of zebrafish. Staked bar chart (A) of relative abundance of bacterial phylum of intestinal microbiota; Principal coordinates analysis (PCoA) (B) of the gut microbiota at phylum level (n = 6). XMX1 represents the group of XMX-1. |
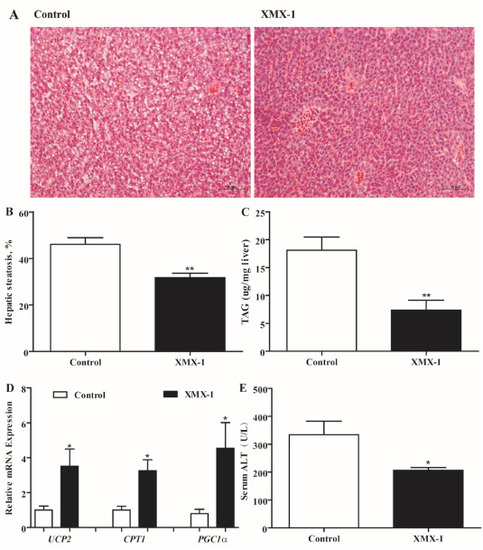
Fig. 6. Effects of control and XMX-1 diet on the lipid fat. (A) Representative liver histology image by H&E staining. The scale bar is 50 μm. (B) Score of hepatic steatosis (%), (C) TAG, (D) The expression of lipolysis related genes, (E) Serum ALT. Data were represented as the means (±SEM) (n = 6). *, p < 0.05 and **, p < 0.01 comparison to the control group. |
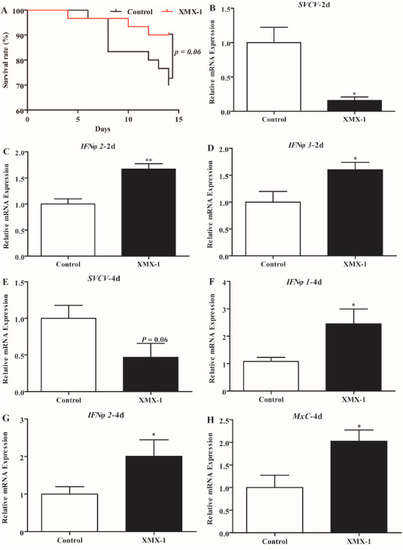
Fig. 7. Effects of dietary XMX-1 on survival rate (A) of zebrafish post SVCV infection and the expression of (B) SVCV-2d, (C) IFNφ2-2d, (D) IFNφ3-2d, (E) SVCV-4d, (F) IFNφ2-4d, (G) IFNφ3-4d, (H) MxC-4d in the spleen of zebrafish fed XMX-1 and control diets two and four days after SVCV challenge. For the survival rate, Log-rank (Mantel-Cox) test was used to analyze. Data were represented as the means (±SEM) (n = 6). *, p < 0.05 and **, p < 0.01 comparison to the control group. |