
- Title
-
Cardioprotective responses to aerobic exercise-induced physiological hypertrophy in zebrafish heart
- Authors
- Chen, Z., Zhou, Z., Peng, X., Sun, C., Yang, D., Li, C., Zhu, R., Zhang, P., Zheng, L., Tang, C.
- Source
- Full text @ J Physiol Sci
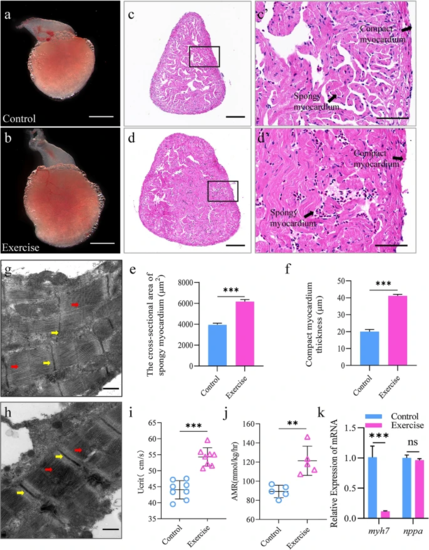
Exercise induces physiological cardiac hypertrophy in zebrafish. a, b Representative images of the overall appearance of the hearts from zebrafish in the control (a) and exercise (b) groups; scale bar = 1 mm; c, d representative H&E-stained cross-sections of the hearts from zebrafish in the control (c) and exercise (d) groups; scale bar = 50 μm. c′, d′ Magnified images of the black boxes in c, d, representing the compact and spongy myocardium; scale bar = 60 μm. e Zebrafish compact myocardium thickness and f cross-sectional area of spongy myocardium per group. g, h Representative transmission electron micrographs of heart tissues from zebrafish in the control (g) and exercise (h) groups; the yellow arrows highlight the Z lines; the red arrows indicate the myofilaments; scale bar = 500 μm. i, j Critical swimming speed (Ucrit) and the active metabolic rate (AMR) increased with continuous exercise. i Ucrit was determined in animals from the sedentary control and exercise groups (n = 8). j AMR was measured in animals from the sedentary control and exercise groups (n = 5). Each symbol represents an animal. The error bars represent the standard error of the mean. Statistical significance was determined using the Student’s t test: **p < 0.01; ***p < 0.001. k mRNA levels of the pathological hypertrophy indicators myh7 and nppa in the heart per group. The error bars represent the standard error of the mean. Statistical significance was determined using the Student’s t test: ns not significant, ***p < 0.001. H&E hematoxylin & eosin |
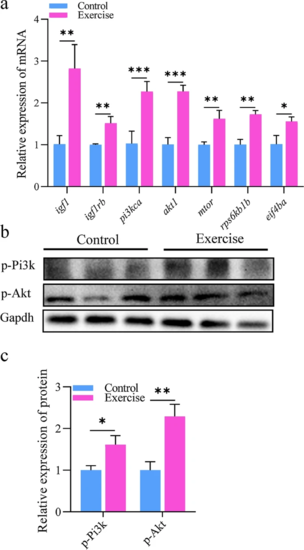
PI3K-AKT signaling is activated after aerobic exercise training. a mRNA levels of IGF1/PI3K/AKT1/mTOR signaling-related genes (essential for protein synthesis) in the hearts of zebrafish. b, c Protein expression of Pi3k and Akt for protein synthesis in the hearts of zebrafish. The error bars represent the standard error of the mean. Statistical significance was determined using the Student’s t test: *p < 0.05; **p < 0.01; ***p < 0.001 |

Aerobic exercise training programs promoted angiogenesis. a Staining of cardiac vessels for vegf in both exercise and control groups; the white arrows refer to the positive staining of blood vessels in the heart of zebrafish, scale bar = 20 μm. b Relative fluorescence of vegf for the two groups analysed by ImageJ. c mRNA expression of genes related to angiogenesis in zebrafish heart. Statistical significance was determined using the Student’s t test: ***p < 0.001, ns not significant |
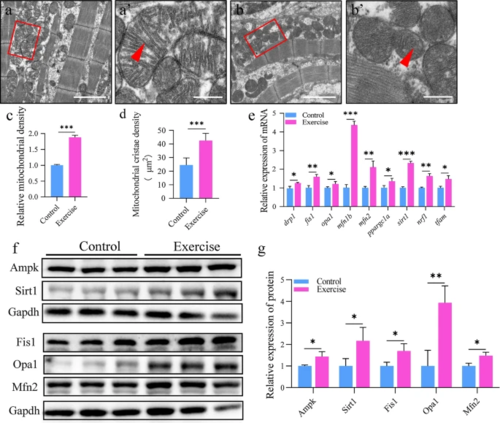
Aerobic exercise induces dynamic changes in mitochondria morphology. a, b Representative transmission electron micrographs of cardiomyocytes from the control (a) and exercise (b) groups; scale bar = 2 μm. a′, b′ Magnified images of the red boxes in a, b, representing the mitochondria; red triangles point to the mitochondrial cristae; scale bar = 0.4 μm. c Relative mitochondrial density. d Mitochondrial cristae density. e mRNA expression of mitochondrial fission and fusion-related genes in zebrafish heart. f, g Protein expression for fission and fusion in the hearts of zebrafish. Statistical significance was determined using the Student’s t test: ***p < 0.001 |
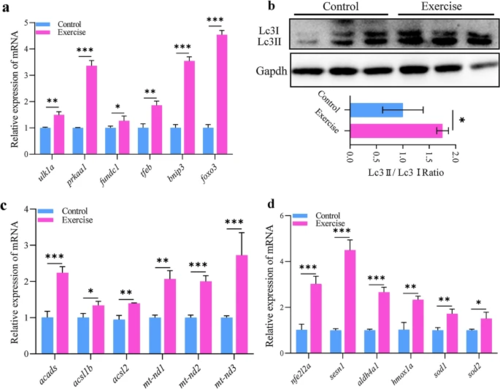
Mitochondrial homeostasis in response to aerobic exercise. a mRNA expression of mitochondrial autophagy markers in the hearts of zebrafish. b Protein expression of Lc3 I and II for autophagy in the hearts of zebrafish. c mRNA expression of lipid metabolism- and electron transport complex I-related genes in the hearts of zebrafish. d mRNA expression of antioxidant machinery-related genes in the hearts of zebrafish. Statistical significance was determined using the Student’s t test: *p < 0.05; **p < 0.01 |
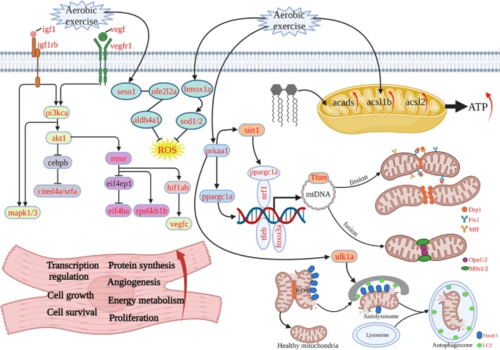
Molecular mechanism of post-exercise regulation of cardiac hypertrophy in zebrafish. (1) Due to the requirement of a large amount of energy supply under training conditions, the mitochondria need to keep homeostasis between energy production and consumption. (2) Mitochondrial function enhancement: aerobic exercise also activated prkaa1-pargc1a signaling, which enhanced mitochondrial biogenesis, division, fusion, and autophagy processes, thus improving mitochondrial function. (3) Elevated cardiac energy metabolic function: a large amount of energy is consumed during aerobic exercise. acads, acsl1b, and acsl2 lipolytic metabolizing enzymes are also activated for expression; (4) improve antioxidant capacity: as exercise generates ROS, excessive ROS can cause damage to organelles and DNA. At the same time, antioxidant genes such as HO1-SOD and SESN1 are activated to scavenge ROS (Created with BioRender.com) |