
|
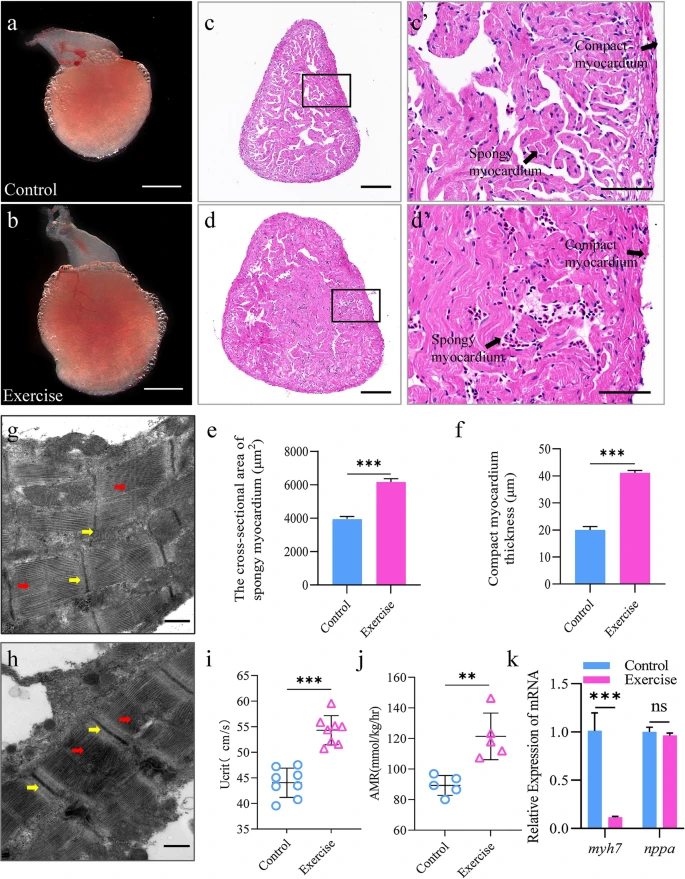
Fig. 1
Exercise induces physiological cardiac hypertrophy in zebrafish. a, b Representative images of the overall appearance of the hearts from zebrafish in the control (a) and exercise (b) groups; scale bar = 1 mm; c, d representative H&E-stained cross-sections of the hearts from zebrafish in the control (c) and exercise (d) groups; scale bar = 50 μm. c′, d′ Magnified images of the black boxes in c, d, representing the compact and spongy myocardium; scale bar = 60 μm. e Zebrafish compact myocardium thickness and f cross-sectional area of spongy myocardium per group. g, h Representative transmission electron micrographs of heart tissues from zebrafish in the control (g) and exercise (h) groups; the yellow arrows highlight the Z lines; the red arrows indicate the myofilaments; scale bar = 500 μm. i, j Critical swimming speed (Ucrit) and the active metabolic rate (AMR) increased with continuous exercise. i Ucrit was determined in animals from the sedentary control and exercise groups (n = 8). j AMR was measured in animals from the sedentary control and exercise groups (n = 5). Each symbol represents an animal. The error bars represent the standard error of the mean. Statistical significance was determined using the Student’s t test: **p < 0.01; ***p < 0.001. k mRNA levels of the pathological hypertrophy indicators myh7 and nppa in the heart per group. The error bars represent the standard error of the mean. Statistical significance was determined using the Student’s t test: ns not significant, ***p < 0.001. H&E hematoxylin & eosin