
- Title
-
Neuron-Radial Glial Cell Communication via BMP/Id1 Signaling Is Key to Long-Term Maintenance of the Regenerative Capacity of the Adult Zebrafish Telencephalon
- Authors
- Zhang, G., Lübke, L., Chen, F., Beil, T., Takamiya, M., Diotel, N., Strähle, U., Rastegar, S.
- Source
- Full text @ Cells

Expression of bmp genes in the adult zebrafish telencephalon. (A–E) ISH with probes directed against bmp2a (A), bmp2b (B), bmp4 (C), bmp7a (D) and bmp7b (E) mRNA on transverse telencephalic sections. While bmp2a (A), bmp7a (D) and bmp7b (E) appear to be expressed in all telencephalic nuclei, bmp2b (B) and bmp4 (C) expression is more confined to the medial region. Red rectangles in (A–E) indicate the coordinates of the region presented in (F–J), respectively. (F–J) Expression of bmp genes revealed by fluorescent FISH (red) on cross-sections of WT telencephala, together with double immunofluorescent staining for NSCs (glutamine synthetase [GS], green) and post-mitotic neurons (Hu, blue). The bmp genes are co-expressed with Hu in neurons (yellow arrows in F–J) but are not expressed in GS+ NSCs (white arrows). (K–L’’’) BMP2b antibody staining (red) along with antibodies against GS (K–K’’’, green) or NeuroD1 (L–L’’’, blue) shows that Bmp2b is expressed in NeuroD1+ neurons. White rectangles (K,L) represent the region magnified in K’–K’’’ and L’–L’’’, respectively. White arrowheads show the GS+ NSCs (K’–K’’’), yellow arrowheads indicate neurons (L’–L’’’). Scale bar = 20 μm (F–J, K’–K’’’,L’–L’’’), 100 μm (A–E,K,L). Dc: central zone of the dorsal telencephalic area; Dl: lateral zone of the dorsal telencephalic area; Dm: medial zone of the dorsal telencephalic area; Vc: central nucleus of the ventral telencephalic area; Vd: dorsal nucleus of the ventral telencephalic nucleus; Vv: ventral nucleus of the ventral telencephalic area. |
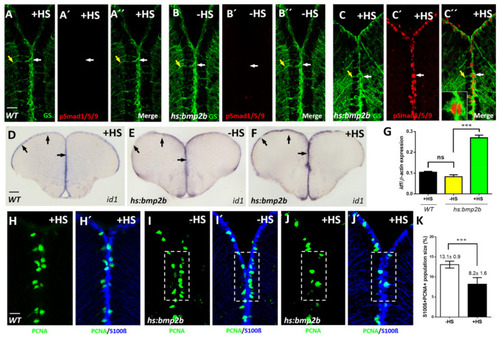
Conditional expression of bmp2b causes activation of BMP signaling, elevated expression of id1 and an increased proliferation of NSCs. (A–C’’) Immunostaining with GS (green) and pSmad1/5/9 (red) antibodies on sections of WT telencephala, treated with heat-shock (A–A’’, +HS) and Tg(hs:bmp2b) telencephala without heat-shock (B–B’’, -HS) or with heat-shock (C–C’’, +HS). pSmad1/5/9 immunoreactivity was detected in GS+ NSCs exclusively in heat-shocked telencephala of the Tg(hs:bmp2b) line. (C’’) inset: a magnified view of a pSmad+/GS+ NSC. Note the nuclear localization of pSmad in contrast to cytoplasmic localization of GS. White arrows show individual NSCs, yellow arrows indicate the processes of the same NSCs (A–C’’). (D–F) ISH on telencephalic cross- sections indicating increased id1 expression after heat-shock-induced bmp2b expression. Black arrows show the expression of id1 in the ventricular zone of WT after heat-shock (D), Tg(hs:bmp2b) after heat-shock (F) and Tg(hs:bmp2b) without heat-shock (E). (G) RT-qPCR analysis of id1 mRNA expression in WT telencephala with heat-shock (WT +HS) and Tg(hs:bmp2b) telencephala without heat-shock (-HS) and with heat-shock (+HS). (H–J’) Immunohistochemistry with antibodies against the NSC marker S100β (blue) and the proliferation marker PCNA (green) on telencephalic transverse sections from WT with heat-shock (H,H’) and Tg(hs:bmp2b) without heat-shock (I,I’) and with heat-shock (J,J’) focusing on the ventricular zone of the dorsal telencephalon. Note that the number of proliferating NSCs (PCNA+/S100β+ cells, dashed, white boxed areas) is reduced in heat-shocked telencephala of the Tg(hs:bmp2b) line (J,J’). (K) Quantification of the PCNA+/S100β+ + cells in telencephala of the Tg(hs:bmp2b) line showing a significant reduction in the heat-shocked (+HS) telencephala compared to the control group without heat-shock. Significance is indicated by asterisks: ns, not significant; *** p < 0.001. n = 3 brains (G), n = 15 sections (K). Scale bar = 20 μm (A–C’’,H–J’), 100 μm (D–F). HS: heat-shock. |
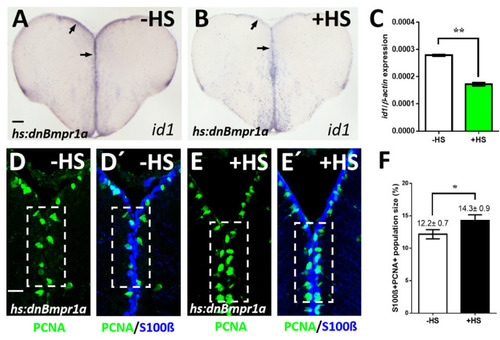
Inhibition of BMP signaling leads to a reduction of id1 expression and an increase of proliferating NSCs. (A,B) Reduced id1 expression after inhibition of the BMP pathway by heat-shock of Tg(hs:dnBmpr1a) animals. Black arrows point at the expression of |
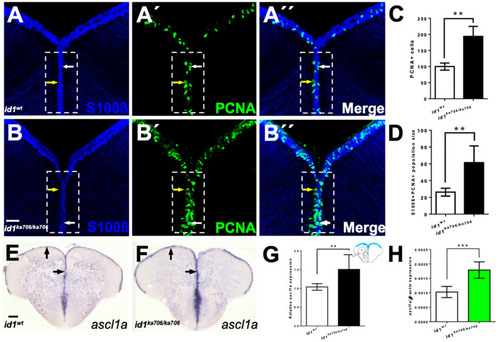
Loss of id1 function leads to an increased number of proliferating NSCs. (A–B’’) NSCs marked by immunohistochemistry with S100β (blue) and PCNA (green) antibodies on telencephalic cross-sections from adult id1ka706/ka706 and WT siblings. The number of PCNA+ cells per brain is increased in the mutant (B’, dashed white boxed area) compared to WT control brains (A’, dashed white boxed area). White arrows show PCNA+/S100β+ cells, yellow arrows show PCNA+ cells. White boxed area indicates area of quantification. (C) Relative population size of PCNA+ cells in WT and id1ka706/ka706 brains. (D) Quantification of the number of proliferating NSCs (type II cells, PCNA+/S100β+ cells) in id1ka706/ka706 and WT siblings. (E,F) Expression of achaete-scute-like1a (ascl1a) mRNA is increased in id1ka706/ka706 telencephala. Black arrows show the expression of ascl1a in the ventricular zone of id1ka706/ka706 mutants and WT siblings. (G) Quantification of ascl1a expression (scheme in the upper right-hand corner displays the quantified area in blue) in mutants and WT siblings. (H) RT-qPCR quantification confirms induction of ascl1a in id1ka706/ka706. Significance is indicated by asterisks: ** p < 0.01; *** p < 0.001. n = 3 brains (A–D), n = 15 sections (G), n = 5 telencephala (H). Scale bars: 20 μm (A–B’’) 100 μm (E,F). |
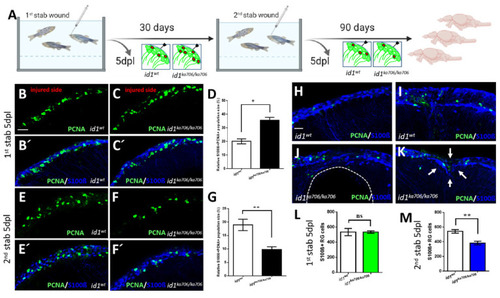
id1 is required to maintain the stem cell pool and the regenerative capacity of the telencephalon. (A) Experimental layout: 6-month-old adult id1ka706/ka706 fish (n = 25) and WT siblings (n = 25) were stabbed with a needle into the right hemisphere of the telencephalon. Fish (n = 2) of each group were sacrificed at 5 days post lesion (dpl) and the remaining fish were allowed to recover for one month before a second stab wound was inflicted. Five days after the second lesion, fish (n = 7) from each group were sacrificed for analysis. The remaining fish were kept for another 3 months before they were sacrificed (n = 16 for WT and n = 11 for id1ka706/ka706 mutants). Note that five mutant fish showed signs of suffering after the second wounding and were sacrificed before the end of the three months recovery. (B–C’, E–F’, H–K) Double immunohistochemistry with S100β (blue) and PCNA (green) antibodies was carried out to mark proliferating NSCs on telencephalic cross-sections from id1ka706/ka706 mutants and WT siblings at the different time points. (B–C’) After the first stab, id1ka706/ka706 mutants showed a higher number of proliferating NSCs. (D) Quantification of the population size of PCNA+/S100β+ cells in relation to the total number of NSCs (S100β+ cells) in WT and id1ka706/ka706 telencephalic cross-sections after the first stab wound. (E–F’) After the second injury, id1ka706/706 mutants showed less proliferating NSCs (PCNA+/S100β+ cells) compared to WT siblings. (G) Quantification of the population size of PCNA+/S100β+ cells in relation to the total number of NSCs (S100β+ cells) in cross-sections through WT and id1ka706/ka706 telencephala. (H–K) WT fish had repaired the lesion in the telencephalon 3 months after the second stab without signs of the injury (H) or with only mild signs of slight tissue disorganization (I). In contrast, id1ka706/ka706 mutants showed severe tissue lesions (J), such as a hole in the parenchyma of the telencephalon (dashed line) or dents in the parenchyma with tissue disorganization (K, white arrows). (L,M) Quantification of the NSCs (S100β+ cells) in the injured side after inflicting the first (L) and second (M) stab wound in WT and id1ka706/ka706 mutants showing a stepwise reduction of the number of NSCs. (Compare also with the increased number of NSCs in the uninjured mutant (Figure S3C)). Significance is indicated by asterisks: ns, not significant; * 0.01≤ p < 0.05; ** p < 0.01. Scale bars: 20 μm (B–C’,E–F’,H–K). |
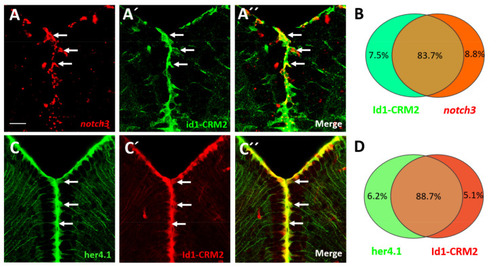
notch3, her4.1 and id1 are co-expressed in the NSCs of the telencephalon. (A–A’’) FISH against notch3 mRNA (A, red) on transverse sections through the telencephalon of Tg(id1-CRM2:gfp) transgenic animals (B, green). A’’ merged view of panels (A,A’). An overlapping pattern of expression for notch3 and Tg(id1-CRM2:gfp) (green) was noted in the telencephalon (white arrows). (B) Summary of co-expression analyses of Tg(id1-CRM2:gfp) with notch3. (C–C’’) Immunostaining on cross sections of the telencephalon of Tg(her4.1:gfp;id1-CRM2:mCherry) double transgenics with antibodies against GFP (green), and mCherry (red). GFP and mCherry signals co-localize indicating that her4.1 and id1 are co-expressed. (D) Summary of co-expression analyses of Tg(id1-CRM2-mCherry) with Tg(her4.1:gfp). n = 3 brains. Scale bar = 20 μm. |

Notch and BMP signaling pathways interact to control quiescence of NSCs. (A–E) Expression of her4.1 revealed by ISH on control telencephala (DMSO, A) or telencephala treated with different concentrations of DMH1 (B), LY411575 (LY, C,D), or a combination of LY and DMH1 (E). (B) 10 μM DMH1 does not influence strongly the expression of her4.1. (C) Notch blockage reduces her4.1 expression along the ventricular zone. (D) After reduction of the concentration of LY to 3 μM, her4.1 expression is still recognizable in the ventricular zone. (E) Combination of 3 μM LY with 10 μM DMH1 blocks her4.1 expression in the ventricular zone suggesting that the two pathways interact. Red rectangles (A–E) illustrate regions of immunostaining in A’–E’. (A’–E’) Cross-sections of the pallial ventricular zone following different concentrations of DMH1 or LY treatment or a combination of both, immunostained for the NSC marker S100β (blue) and the proliferation marker PCNA (green). The proportion of PCNA+/S100β+ cells is increased in the groups treated with 6 μM LY alone (C’,C’’) or treated with a combination of 3 μM LY and 10 μM DMH1 (E’,E’’). (F) RT-qPCR analysis of her4.1 mRNA expression under different conditions of drug treatment. (G) Quantification of the relative population size of PCNA+/S100β+ cells under different conditions. Significance is indicated by asterisks: ns, not significant; * 0.01 ≤ p < 0.05; ** p < 0.01; *** p < 0.001. Scale bars: 20 μm (A’,A’’,B’,B’’,C’,C’’,D’,D’’,E’,E’’), 100 μm (A,B,C,D,E). |