
- Title
-
Bucky Ball Is a Novel Zebrafish Vasa ATPase Activator
- Authors
- Perera, R.P., Shaikhqasem, A., Rostam, N., Dickmanns, A., Ficner, R., Tittmann, K., Dosch, R.
- Source
- Full text @ Biomolecules
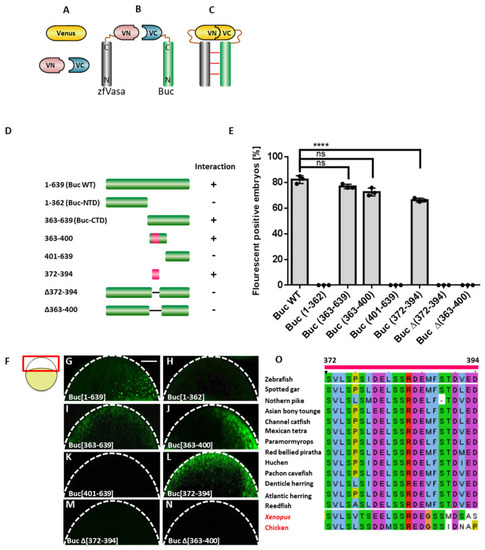
Mapping of the Vasa-binding motif in Buc (Buc-VBM). (A–C) Illustration of the BiFC assay. (A) Venus protein (yellow) is split into two nonfluorescent parts, Venus N-terminus (VN; rose) and Venus C-terminus (VC; blue) (B) Fusion of zfVasa (grey) and Buc (green) with VN and VC fragments, respectively. (C) Interaction of zfVasa and Buc (horizontal red lines) reconstitute a functional Venus protein forming a bimolecular fluorescent complex. (D) Schematic illustration of the systematic truncation of Buc (green). Numbers left to the colored bars indicate the corresponding amino acids. Interactions are marked by a ‘+’, while no interactions as ‘-’. Buc-VBM is indicated in pink. (E) Quantification of the fluorescent-positive embryos based on different combinations of the BiFC Buc and zfVasa constructs. The data presented are averaged from three independent experiments. The Y-axis represents a percentage of the average fluorescent embryos, and the X-axis represents injected constructs. (G–N) Confocal images of live embryos at 3 hpf (hours post-fertilization) after the injection of Buc constructs with wild-type zfVasa. The imaging area is boxed in red, as indicated in the cartoon on the left (F). This region is outlined with a white dashed line (G–N). The injection of wild-type Buc showed a fluorescent signal (G; 82 ± 3.9%, n = 58). After splitting Buc into Buc-NTD (amino acids 1–362) and Buc-CTD (amino acids 363–639), only the Buc-CTD show fluorescence (I; 77 ± 5.7%, n = 79), and there is no florescence with Buc-NTD (H; 0 ± 0%, n = 105). Splitting Buc-CTD into two parts, the construct containing the amino acids 363–400 showed fluorescent embryos (J; 72 ± 4.1%, n = 79) but not the amino acids 401–639 (K; 0 ± 0%, n = 77). Interestingly, the highly conserved domain of Buc (amino acids 372–394) displayed fluorescence (L; 66 ± 2.8%, n = 69). No fluorescent signal was observed after deleting amino acids 372–394 in full-length Buc (BucΔ (372–394) (M; 0 ± 0%, n = 71) and BucΔ (363–400) (N; 0 ± 0%, n = 64). (O) Multiple sequence alignment revealed that amino acids 372–394 (labeled on the top of the sequence) are highly conserved in the Buc homolog in Xenopus and the Xvelo and Buc homologs in chickens, in addition to Buc orthologs in other teleost species. Amino acids are colored based on the ClustalX color code. Hydrophobic amino acids are (Alanine (A), Isoleucine (I), Leucine (L), Methionine (M), Phenylalanine (F), Tryptophan (W), and Valine (V)) colored in blue. Positively charge amino acids ((Lysine (K) and Arginine (R)) are colored in red. Negatively charge amino acids ((Aspartic acid (D) and Glutamic acid (E)) are colored in magenta. Polar amino acids ((Asparagine (N), Glutamine (Q), Serine (S), and Threonine (T)) are colored in green. Aromatic amino acids ((Histidine (H) and Tyrosine (Y)) are colored in cyan. Cystine is colored in pink. Glycine is colored in orange. Proline is colored in yellow. Protein sequences for Buc orthologs were retrieved from the Ensembl database (Ensembl Release 104), except the Buc homolog in Xenopus and the Xvelo and Buc homologs in chickens, which were retrieved from Xenobase Version 5.3.0 and the NCBI protein database, respectively [38,39]. The protein sequences used for multiple sequence alignment were: ENSDARP00000125536; Zebrafish (Danio rerio), ENSLOCP00000015864; Spotted gar (Lepisosteus oculatus), ENSELUP00000012527; Northern pike (Esox luciusI), ENSSFOP00015022504; Asian bonytongue (Scleropages formosus), ENSIPUP00000003130; Channel catfish (Ictalurus punctatus), ENSAMXP00000053358; Mexican tetra (Astyanax mexicanus-2), ENSPKIP00000037210; Paramormyrops (Paramormyrops kingsleyae ),ENSPNAP00000033609; Red-bellied piranha (Pygocentrus nattereri),ENSHHUP00000031919; Huchen (Hucho hucho), ENSAMXP00005041590; Pachon cavefish (Astyanax mexicanus-1), ENSDCDP00000002250; Denticle herring (Denticeps clupeoides), ENSCHAP00000009659; Atlantic herring (Clupea harengus), ENSECRP00000007749; Reedfish (Erpetoichthys calabaricus), XB-GENE-5934753; Xenopus (Xenopus laevis), {"type":"entrez-protein","attrs":{"text":"XP_040546153.1","term_id":"2024370216","term_text":"XP_040546153.1"}}XP_040546153.1; and chicken (Gallus gallus). Test statistics: Student’s t-test, **** = 0.0001. ns. = nonsignificant. Error bars represent the standard deviation of the mean. Scale bar 100 µm. |

Mapping the Buc-binding motif in zfVasa (zfVasa-BBM). (A) Schematic illustration of the systematic truncation of zfVasa (dark grey) with a helicase core containing the N-terminal (blue) and C-terminal (light rose) RecA-like domains. Numbers left to the colored bars indicate the corresponding amino acids. (B) Quantification of fluorescent-positive embryos based on the microinjection of mRNA encoding the different combinations of BiFC Buc and zfVasa constructs. The data presented are averaged from three independent experiments. The Y-axis represents the percentage of fluorescent embryos, and the X-axis shows the injected constructs. Error bars represent the standard deviation of the mean. Average fluorescent-positive embryos ≥ 60% denoted as ‘++’, average fluorescent-positive embryos ≤ 60% shown as ‘+’, and embryos with no fluoresce denoted as ‘-‘. (D–K) Confocal images of live embryos at 3 hpf (hours post-fertilization) after the injection of zfVasa constructs with wild-type Buc. (C) The imaging area is boxed in red, as indicated in the cartoon on the left. This region is outlined with a white dashed line (D–K). Injection of wild-type zfVasa showed a fluorescent signal (D; 77 ± 3.0%, n = 96). After splitting zfVasa, zfVasa-IDR (amino acids 1–277 and labeled in orange on top of (A)) did not show fluorescence (E; 0 ± 0%, n = 43), but zfVasa-HC (amino acids 278–715 and labeled in orange on top of (A)) showed a fluorescent signal (F; 70 ± 4.0%, n = 85). From the three constructs of zfVasa-HC, the construct containing the amino acids 278–495 did not show an interaction signal (G; 0 ± 0%, n = 57). Besides, the construct containing the amino acids 496–623 showed more fluorescent embryos (H; 64 ± 4.0%, n = 76) than the other construct containing amino acids 624–715 (I; 14 ± 5.0%, n = 55). The zfVasa construct containing the amino acids 600–625 isolated a minimum peptide, which interacted with Buc (J; 69 ± 8.2%, n = 64). No fluorescent signal was observed after removing amino acids 600–625 in full-length zfVasa (zfVasaΔ (600–625)) (K; 0 ± 0%, n = 71). (L) SDS-PAGE (15%) stained with Coomassie Brilliant Blue. GST pull-down assay performed with recombinant GST-Buc-VBM (expected molecular weight approximately 32 kDa) and zfVasa (residues 227–670; expected molecular weight approximately 56 kDa). Protein markers (in kDa) are indicated in the middle. Compared to the control input samples (lanes 1–3), the pull-down (lanes 5–7) GST-Buc-VBM brings down zfVasa, suggesting that both fragments directly bind to each other. Scale bar 100 µm. Test statistics: Student’s t-test, **** = 0.0001. ns. = nonsignificant. |

Buc-VBM adopts α-helices from its disordered nature in vitro. (A) In silico prediction of α-helices in Buc-VBM. In all three algorithms, the predicted α-helices are denoted as ‘H’ in red, β-sheets as ‘E’ in green, and turns as ‘T’ in black. The consensus secondary structure is shown at the bottom. Note that random coils in the consensus structure are denoted as ‘C’ in light blue. The first (363) and last (400) amino acids of Buc-VBM are displayed on top of the sequence (A–C). The highly conserved amino acids 372–394 are denoted by a pink, horizontal bar. (A) Secondary structure prediction using the CFSSP algorithm. The algorithm predicted two α-helices, α1 and α2. The α1-helix contains the amino acid sequence ERQS (orange), and α2 contains the amino acid RDEM (orange). CFSSP also predicted two β-sheets (green E), which contain the amino acids YPQ at the N-terminus and MFS at the C-terminus. (B) Secondary structure prediction using the PEP2D algorithm. The algorithm predicted two α-helices, α1 and α2, which share the same amino acids predicted by the CFSSP algorithm. (C) Secondary structure prediction using the Jnet algorithm. The algorithm predicted two α-helices, α1 and α2, which share the same amino acids predicted by the CFSSP algorithm and PEP2D algorithm. (D) Investigation of the secondary structure for Buc-VBM (amino acid 363–400) using CD spectroscopy. The Y-axis represents molar ellipticity ((θ)), which is corrected for the concentration. The X-axis represents the corresponding wavelengths. In the native aqueous conditions and neutral pH, the CD spectra calculated for Buc-VBM were typical for a disordered protein (very low CD spectra above 210 nm and negative spectra near 195 nm: black line). After the addition of different concentrations of the crowding agent TFE (35% red line and 50% blue line), Buc-VBM displays CD spectra characteristic for α-helices (negative CD spectra at 222 nm and 208 nm and positive spectra at 193 nm). (E) The C-score values predicted for the homology models of zfVasa by the I-Tasser program. (F) The model with the highest C-score (−0.87) was selected as the homology model for zfVasa. The RecA-NTD of zfVasa is colored in marine blue, while RecA-CTD is colored in salmon. (G) The structure solved for Drosophila Vasa (DmVasa). The structure is composed of the amino acids 200–623 (PDB ID 2DB3 [44]). RecA-NTD of DmVasa is colored in magenta, while RecA-CTD is colored in blue. (H) Superposition of the DmVasa and zfVasa structures using the PyMol tool shows that two structures have nearly identical secondary structures (root mean square deviation (RMSD) = 0.333). |

Isolation of the amino acid residues responsible for Buc and zfVasa interactions. (A) Alignment of the Buc-VBM with the Oskar eLOTUS domain. An asterisk (*) denotes the positions with a fully conserved residue. A colon (:) denotes conservation based on strongly similar properties—scoring > 0.5 in the PAM 250 matrix. A dot (.) denotes conservation based on weakly similar properties—scoring ≤ 0.5 in the PAM 250 matrix. An alignment of Buc-VBM and the eLOTUS domain revealed that D379, E384, and S386 are conserved between two sequences (black stars and positions of the amino acids are labeled on top of the sequence). (B) Representation of the three amino acids D379, E386, and S389 in JPred secondary structure prediction (black boxes) and amino acid R384 (blue box) used as a non-conserved control. (C) Quantification of mutant Buc construct interactions with zfVasa. The Y-axis represents the average fluorescent positive embryos. The X-axis represents the injected mutant Buc constructs. All the mutants, Buc D379L (36 ± 5.1%, n = 86), E386L (48 ± 9.4%, n = 77), and S389A (43 ± 3.4%, n = 50), showed a reduction of fluorescent embryos compared to wild-type Buc (70 ± 4.6%, n= 69) or in the control R384G (63 ± 8.2%, n = 63). In particular, the D379L mutant variant showed the weakest activity when compared to the Buc wild-type and control R384G. (D) Homology model predicted for zfVasa with the RecA-like N-terminal domain (blue) and RecA-like C-terminal domain (salmon). zfVasa-BBM is colored in magenta. (E) Surface representation of the predicted model showing the exposed region of zfVasa-BBM (magenta). (F) Model highlighting the exposed three amino acids (inset in the black dashed line) in the rainbow colors described in (D). (G) Magnification of the exposed amino acids S607 (blue), S608 (green), and I609 (orange). (H) Quantification of the mutant zfVasa construct interactions with Buc. The Y-axis represents fluorescent embryos from three independent experiments. The X-axis represents the injected mutant zfVasa constructs. zfVasa S607A (38 ± 14.0, n =61) and zfVasa S608A (27 ± 8.0, n = 33) showed a reduced number of fluorescence-positive embryos, whereas zfVasa I609Q completely lost the interaction (0 ± 0, n = 61) compared to the wild-type zfVasa (79 ± 6.4, n = 64). Moreover, there was no significant statistical difference observed between zfVasa S607A and S608A. Test statistics: Student’s t-test, * = 0.05, ** = 0.01, *** = 0.001, and **** = 0.0001. ns = not significant. |
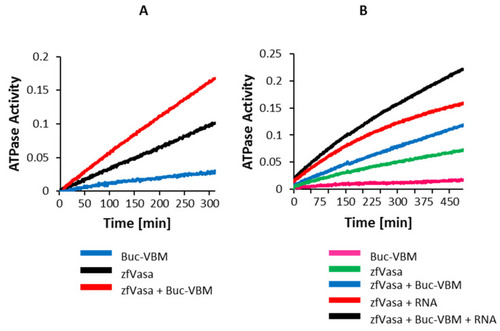
Buc-VBM activates Vasa helicase activity. (A,B) The Y-axis denotes the ATPase activity as a function of the reduction of NADH absorption at 340 nm. The X-axis denotes the incubation time in minutes. The data presented are averaged from three independent experiments. (A) The incubation of 100-µM Buc-VBM with 2.5-mM ATP showed very mild ATPase activity (negative control, blue line). A higher background ATPase activity was observed after the incubation of 5-µM zfVasa with 2.5-mM ATP (black line). Fascinatingly, the ATPase activity was approximately doubled when 100-µM Buc-VBM was added to 5-µM zfVasa and 2.5-mM ATP. (B) The incubation of 100-µM Buc-VBM with 2.5-mM ATP showed mild ATPase activity (pink line). The incubation of 5-µM zfVasa with 2.5-mM ATP displayed relatively higher ATPase activity (green line). The incubation of 5-µM zfVasa with 50-µM ssRNA showed enhanced ATPase activity (red line) compared to 5-µM zfVasa with 100-µM Buc-VBM (blue line). zfVasa ATPase activity was further enhanced in the presence of ssRNA and Buc-VBM (black line). |

Buc-VBM and zfVasa-BBM inhibit germ cell specification in vivo. (A) Cartoon representation of the lateral view shown in panels (B–D) of 15–18-somite stage zebrafish larvae, with the animal to the left. Imaging area boxed in red. (B) Live un-injected embryos with fluorescent germ cells (green cells (white arrow); transgenic for Buc-GFP). (C) Embryos injected with Buc-VBM and (D) zfVasa-BBM. (E) Quantification of the germ cell number. Embryos injected with either Buc-VBM (6 ± 1.0, n =18) or zfVasa-BBM (6.3 ± 1.1, n = 16) showed a reduction of germ cells compared to the un-injected embryos (12 ± 1.6, n = 15). Additionally, we did not observe a significant statistical difference between Buc-VBM and zfVasa-BBM. The data presented are averaged from three independent experiments. The Y-axis represents the average germ cell count, and the X-axis represents the injected constructs Buc-VBM and zfVasa-BBM. Error bars represent the standard deviation of the mean. (F) Hypothetical model of the Buc-zfVasa interaction. Buc (green line) binds directly to zfVasa (black line) through zfVasa-BBM (orange) and Buc-VBM (pink). During the interaction, disordered Buc-VBM adopts an α-helical structure. Conversely, Buc-VBM stimulates the ATPase activity of zfVasa (blue arrow), which is further enhanced when RNA (red line) binds to zfVasa. The helicase activity probably triggers an unknown downstream RNA processing specifying primordial germ cell development. Scale bar 50 µm. Test statistics: Student’s t-test, ** = 0.01. ns = nonsignificant. |