FIGURE SUMMARY
Title

Alpha-synuclein aggresomes inhibit ciliogenesis and multiple functions of the centrosome

Authors
Iqbal, A., Baldrighi, M., Murdoch, J.N., Fleming, A., Wilkinson, C.J.
Source
Full text @ Biol. Open

Aggresomes can be formed in cells by overexpression of alpha synuclein or MG132 treatment. (A,A′) Vimentin (red) in control HeLa cells forms a fibrous network around the nuclei (DAPI, blue), which is unaffected by the expression of the GFP. (B,B′) When expressing GFP- α-syn, vimentin-positive aggresomes appear in cells, juxtaposed to the nucleus. Similar results are obtained with GFP-α-synA30P (C,C′) and GFP-α-synA53T mutants (D,D′) and in SH-SY5Y cells treated in the same way (E–H). (I–L) Aggresomes can also be induced by treatment with MG132. (I,J) The vimentin distribution changes from a filamentous pattern around the nuclei to caging the aggresome. (K,L) γ-tubulin (red) staining the centrosomes as two punctae in control cells (K). Following MG132 treatment, γ-tubulin forms a condensed structure around the aggresome (L). (M–P) The expression pattern of endogenous α-syn was also investigated to determine whether this protein co-localises within the aggresome. (M,M′) In control cells, endogenous α-syn (green) staining was widespread and diffuse within the cytoplasm with vimentin (red) forming a filamentous network. (N,N′) Following MG132 treatment, α-syn aggregates were observed and co-localised with vimentin staining within the aggresomes. (O,O′) In control cells, γ-tubulin (red) was observed as two punctae with α-syn diffuse within the cytoplasm. (P,P′) γ-tubulin staining (red) also co-localises with endogenous α-syn in the aggresome when treated with MG132. (Q,Q′) Differentiated SH-SY5Y cells were mock-treated and vimentin (red) staining was observed surrounding the nuclei as well as along the axon. (R,R′) In cells treated with MG132 (1 μM for 18 h) vimentin staining changed to a compact structure near the nucleus, indicative of aggresomes. (S) In mock-treated cells, γ-tubulin formed two punctae next to the nucleus. (T) In MG132 treated cells, aggresomes were detected by γ-tubulin staining. Differentiated SH-SY5Y cells are TH positive (green). (U,U′) In rat basal ganglion neurons, vimentin staining (red) is abundant around the nuclei and along the axon. (V,V′) When treated with MG132, vimentin localises to the aggresome. (W) In rat basal ganglion neurons, the γ-tubulin is observed at two punctae close to the nucleus. (X) Upon MG132 treatment, the γ-tubulin staining now forms a larger structure next to the nucleus. (Y) In untreated RPE1-hTERT cells, γ-tubulin stains the centrosome. (Z) Upon MG132 treatment it stains the aggresome. (α,β) Similar results are obtained with MEFs. Scale bars: 10 μM. DNA/nuclei stained with DAPI (blue) where indicated.

Microtubule nucleation is disrupted in the presence of aggresomesin undifferentiated and differentiated SH-SY5Y cells. (Ai–iv) SH-SY5Y cells have an extensive microtubule network. Upon cold treatment (4°C, t=0), microtubules depolymerise. Upon warming, microtubules nucleate from the centrosome forming a characteristic aster, which continues to grow until the network is re-established. In SH-SY5Y cells the aster is seen within in 30 s (37°C, t+0.5) and the microtubule network is re-established within 10 min (37°C, t+10). (Av–viii) In the presence of aggresomes formed by the overexpression of α-syn (GFP-fusion), the centrosome is unable to re-establish the network in 10 min. (Aix–xvi) The same result is achieved by overexpression of α-syn A30P and A53T familial mutants. (Axvii–xx) In the presence of aggresomes formed after MG132 treatment, the centrosome is unable to nucleate microtubules to re-establish this network. (Axxi–xxiv) In differentiated SH-SY5Y (tyrosine hydroxylase, TH, in green), microtubule nucleation is seen as asters from the centrosome (arrow heads and inset). (Axxv–xxviii) In the presence of aggresomes the density of the network is reduced and microtubule nucleation is severely compromised. (B) Quantification of microtubule regrowth in experiments in A [P=0.0001, one-way ANOVA (for α-syn over-expression), 100 cells, n=3 replicates; P=0.0001, by Student's t-test (MG132 experiments), 100 cells, n=3 replicates]. Microtubule nucleation and re-establishment of this network was quantified by scoring cells (yes or no) whether the network was re-established in 10 min. Microtubule staining for α-syn experiments shown separately in Fig. S1 together with GFP control. Scale bars: 10 μM.

Aggresomes reduce rate of cell migration and inhibit polarity changes. (A–D) RPE1 cells close a scratch/wound in 8 h. (E–H) In the presence of aggresomes, minimal cell migration is detected. (I-L) MEFs close a scratch-wound assay in 8 h whereas those treated with MG132 to induce aggresomes fail to do so (M–P). (Q,R) In control cells, the Golgi (red) orientates from a random direction to face the leading edge of the wound. (S,T) In the presence of aggresomes, this change in orientation was not seen. (U,V) Quantification of change in angle of orientation during cell migration with a schematic diagram showing how the Golgi orientation was measured. (P=0.0011, by Student's t-test, 100 cells, n=3 replicates). Scale bars: 100 μM. Nuclei stained with DAPI (blue).

Aggresomes inhibit ciliogenesis. All panels: DNA/nuclei stained with DAPI (blue), green label is indicated in each panel, cilia (white arrows) can be identified by acetylated tubulin (red). (A–F) When transfected with a GFP-α-syn expression plasmid (α-syn and A30P and A53T familial mutants) or treated with MG132, cilia formation is inhibited in undifferentiated SH-SH5Y cells (B, C and D versus A, F versus E). In the presence of aggresomes differentiated SH-SY5Y cells are no longer able to form cilia (H versus G). When treated with MG132, TH-positive basal ganglion neurons are no longer able to form cilia (J versus I). The acetylated tubulin signal (red) in J and I is overexposed to ensure no cilia were missed. (K) Quantification of ciliation: GFP expressing versus GFP-α-syn expression, (P=0.0003, by one-way ANOVA, 100 cells, n=3); undifferentiated SH-SY5Y, untreated versus MG132, (P=0.0001, by Student's t-test, 100 cell, n=3); differentiated SH-SY5Y, untreated versus MG132, (P=0.0001 by Student's t-test, 100 cells counted, n=3). Scale bars: 10 μM.

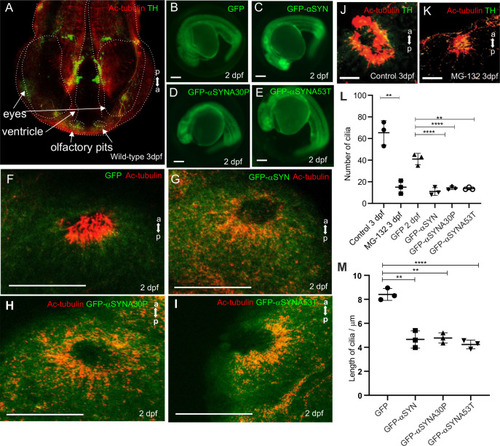
Olfactory cilia in zebrafish larvae are severely reduced in the presence of aggresomes. (A) The neuronal dopaminergic network in 3 dpf zebrafish forebrain viewed from the dorsal aspect, detected by TH-staining (green). Acetylated tubulin (red) stains axon tracts and cilia. (B–E) Overexpression of control GFP or α-syn, α-synA30P, α-synA53T familial mutations does not cause any anatomical defects in zebrafish larvae. (F) By 3 dpf extensive numbers of cilia are visible at the olfactory pit. (G–I) Overexpression of any of the three forms of α-syn (wild type, A30P or A53T) severely reduces numbers of cilia in the olfactory pit. Cilia length is also reduced. (J,K) Embryos treated with MG132 showed an extensive reduction in number of cilia. (L) Quantification of cilia numbers from above experiments (P=0.001, by one-way ANOVA, n=3). Cilia were counted from the confocal generated z-stacks, projected images of which are shown in this figure. (M) Quantification of length of cilia from F-I (P=0.0088, by one-way ANOVA, n=3). Scale bars: 100 μM.

EXPRESSION / LABELING:
Antibody:
Fish:
Anatomical Term:
Stage: Protruding-mouth
Acknowledgments
This image is the copyrighted work of the attributed author or publisher, and ZFIN has permission only to display this image to its users. Additional permissions should be obtained from the applicable author or publisher of the image. Full text @ Biol. Open