
- Title
-
CARMIL3 is important for cell migration and morphogenesis during early development in zebrafish
- Authors
- Stark, B.C., Gao, Y., Sepich, D.S., Belk, L., Culver, M.A., Hu, B., Mekel, M., Ferris, W., Shin, J., Solnica-Krezel, L., Lin, F., Cooper, J.A.
- Source
- Full text @ Dev. Biol.
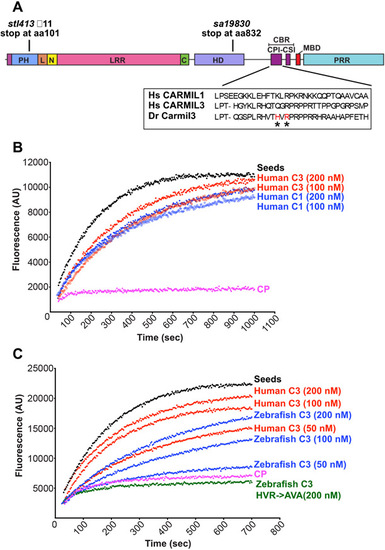
CARMIL3 inhibits capping protein (CP) activity in actin polymerization assays, with pyrene-actin fluorescence (arbitrary units) plotted vs time. (A) Cartoon of the zebrafish Carmil3 protein illustrating its functional domains, and the positions of two zebrafish mutations studied here, carmil3sa19830 and carmil3stl413 and the location of the CBR mutations. PH, Pleckstrin Homology; L, linker; N, N-cap; LRR, Leucine Rich Repeat; C, C-cap; HD, helical / homodimerization domain; CBR, Capping protein Binding Region; CPI, capping protein interaction; CSI, CARMIL-specific interaction; MBD, membrane-binding domain; PRR, Proline Rich Region. Amino acid sequences for uman CARMIL1 and 3 and D. rerio Carmil3 for the CPI region are in a box, with and the location of the D. rerio mutant known as HVR->AVA denoted by asterisks. (B) Human CARMIL3 (C3) inhibited the ability of CP to cap barbed ends of actin filaments. Black points, labeled “Seeds,” are from a control with monomeric actin and filamentous actin seeds. Pink points, labeled “CP,” correspond to a sample to which CP was added. Red and blue curves contain CP plus the indicated concentrations of human CARMIL1 or CARMIL3 CBR fragment. (C) Zebrafish Carmil3 (C3, blue curves) CBR fragment inhibited capping by CP. In comparison to human CARMIL3 (C3, red curves), the inhibitory activity of zebrafish Carmil3 was slightly less than that of human CARMIL3, based on similar concentrations as indicated. A mutant form of zebrafish Carmil3 CBR fragment (C3-HVR->AVA, green curve) containing two point mutations at conserved residues of the CP-binding CPI motif (Fig. 1A), failed to block CP activity, as expected. |

Abnormal endodermal cell migration in carmil3 mutant embryos during gastrulation. (A) Representative images illustrating the patterns of sox17 expression in endodermal cells and DFCs detected by WISH in WT and MZcarmil3sa19830 mutant embryos. Red dotted line indicates the leading edge of the endoderm, used to measure migration distance. (B) Schematic diagram of zebrafish gastrula illustrating the distance of the leading edge of the migrating endoderm cells to DFCs. In the plot, each data point corresponds to one embryo. Values for the distributions were as follows (mean ± s.d.): WT 74 ± 25 (number of embryos, N=50), MZcarmil3sa19830 mutant 144 ± 28 (N=44). Asterisk (*) indicates p value of <0.0001 in Student’s t-test. Panels C through G are in vivo migration analysis of EGFP-labelled endodermal cells performed by epifluorescence time-lapse experiments on +/−-carmil3sa19830 or MZcarmil3sa19830 mutant embryos in the Tg(sox17:EGFP) background. (C, E) Snapshots at 80% epiboly stage from the time-lapse movie, with the tracked cells labeled. (C’, E') Snapshots at 95% epiboly stage, with the migration tracks of endodermal cells from the 80% to 95% epiboly stage superimposed. Scale bar: 100 μm. (D, F) Migration tracks delineate routes of endodermal cells. Solid magenta squares denote the endpoint of migration. (G) Total speeds, net speeds, and migration persistence. The number of embryos and cells analyzed is indicated above the graphs. Asterisks (****) indicate p value of <0.0001 in Student’s t-test. EXPRESSION / LABELING:
PHENOTYPE:
|

Patterns of dorsal forerunner cell (DFC) distribution in MZcarmil3sa19830 mutant embryos compared to control heterozygous MZcarmil3sa19830/+ embryos. Panels A to E illustrate the patterns observed, with results quantified in panel F. In most control embryos, DFCs form a single tight cluster of normal size (light blue arrow in panel A and light blue bars in panel F). In some embryos, DFCs display three patterns of defects: B) normal size with mild splitting (i.e., two clusters); C) normal size with severe splitting (more than two clusters); D) small size with no splitting; E) small size with splitting. (F) Percentages of embryos displaying the patterns of DFC distribution in control gastrulae and both MZcarmil3sa19830 and MZcarmil3stl413 mutants. The percentage of embryos in each group is indicated above each bar, and the total number of embryos in each group (N) is listed underneath the labels on the abscissa. EXPRESSION / LABELING:
PHENOTYPE:
|

Morphology of Kupffer’s vesicle (KV) and cilia in carmil3 mutant embryos. (A) Line drawing of a 6-somite stage embryo in a lateral view with KV outlined in green. On the right side is an image of a Tg(sox17:GFP) labeled KV. (A’) Line drawing of a posterior view of the 6-somite stage embryo. This view was used to collect confocal images. On the right side is a maximum intensity z projected image showing KV. Panels B through C are from one analysis, based on wide-field fluorescence images showing the morphology of sox17-EGFP labelling of the KV in +/− carmil3stl413 control (B) and MZcarmil3stl413 mutant (B’ and B”') embryos at the 6-somite stage. The KV is outlined by the dashed yellow line. (C) Area of the KV in +/− carmil3stl413 control and MZcarmil3stl413 mutant embryos. All the data points are shown. The red lines indicate the mean and one standard error of the mean. The results are statistically significant with a p value of < 0.0001 based on Student’s t-test. The number of embryos analyzed was 15 for control and 30 for mutant. In this set of experiments, the control was a heterozygous strain. Panels D and E show results of the experiments testing if injected WT carmil3 RNA can rescue KV area in MZcarmil3 mutants. KV area was scored similarly to Figure 4 panel B. (D) Data from individual clutches are presented in the same color, e.g., orange colors are injections into a WT clutch of a control RNA, 2.5, or 5 pg of WT carmil3 RNA. Variability in ranges correlates with different clutches. Clutches used for only one injection are in grays. (E) Unpaired Student’s T-test with unequal standard deviation for rescue experiments. We plotted average area for each injection condition, with Standard Error of the Mean. Comparisons with significant p values are indicated by bars. EXPRESSION / LABELING:
PHENOTYPE:
|
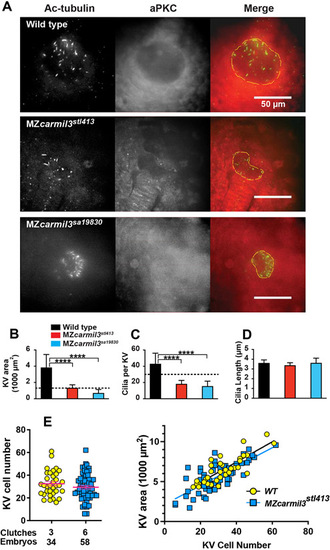
Smaller Kupffer’s vesicles (KV) in MZcarmil3 mutants are composed of fewer cells and have reduced number of cilia. (A) Confocal images of embryos at the 10-14 somite stage stained to visualize cilia and the KV, with antibodies to acetylated tubulin (Ac-tubulin, Green in Merge), and to atypical PKC (aPKC, Red in Merge) respectively. With anti-aPKC staining, the KV lumen appears as a relatively dark area, owing to the absence of cells inside the vesicle. WT and two different carmil3 alleles are shown. The merge panel shows examples of how the KV lumen was outlined for calculation of area; the outline is based on both Ac-tubulin and aPKC images. Panels B through D are graphs of parameters quantified from the images, with the color scheme for WT and mutants as indicated. In each panel, the plotted values are the mean, and the error bars correspond to one standard deviation. (B) Area of the KV. Horizontal dotted line corresponds to the value for area of KV found to be necessary for robust L/R patterning by Gokey and colleagues (Gokey et al., 2016). Values for the two mutants differ from the value for WT based on Student’s t-test (p<0.005 (actual=0.0006 and 0.0005)). (C) Number of cilia per KV. Horizontal dotted line corresponds to the value for number of functional cilia per KV (30) found to be necessary for robust left / right patterning by Sampaio and colleagues (Sampaio et al., 2014). Values for the two mutants differ from the value for wild type based on Student’s t-test (p<0.005 (Actual=0.0001 and 0.0004)). (D) Length of cilia. Values for the two mutant lines do not differ from the value for WT embryos based on Student’s t-test (p=0.3277 and >0.9999). Values of N (embryos counted) as follows: WT, 9; MZcarmil3stl413, 8; MZcarmil3sa19830, 4 for panels B to D. (E) Panel E shows a second experimental series with a different set of animals than those in panels A-D. Left side: The number of cells in the KV at the 6-somite stage is reduced in MZcarmilstl413 (29.4) relative to WT (32.5), without statistical significance. Each was injected with a control RNA (~12.5 pg of Histone2B-RFP). Right side: The total area of KV is proportional to the number of cells. The same KVs examined for the cell number on the left were measured for area on the right. EXPRESSION / LABELING:
PHENOTYPE:
|

Patterns of spaw staining distribution at the 18-20 somite stage in carmil3 mutant embryos compared with WT embryos. (A) Representative images illustrate observed patterns of spaw staining, which is purple. (B) Percentage of spaw staining patterns, comparing WT embryos with embryos of two different carmil3 alleles, MZcarmil3stl413 and MZcarmil3sa19830. The color scheme is indicated in panel A, below the images. In cases scored as “absent,” no staining was observed. Values are listed in Table I. EXPRESSION / LABELING:
PHENOTYPE:
|

Heart position in MZcarmil3 mutant embryos compared to WT embryos at ~30 hpf, assessed by staining for transcripts of myl7, the gene encoding cardiac myosin light chain, in blue. (A) Representative images illustrate observed patterns. (B) Quantification of the sum of the two altered patterns, termed “heart jogging,” in two different MZcarmil3 mutant embryo lines compared with WT embryos. WT embryos displayed the abnormal (to the right or center) heart jogging phenotype 0.25% of the time (N=784). This value was significantly higher in the mutant embryos: 8.6% for MZcarmil3stl413 (N=198) and 5.8% for MZcarmil3sa19830 (N=415). Error bars indicates standard error of proportion. P values were calculated from Fisher’s exact test calculated with GraphPad Prism. Asterisks indicate that for both mutants, compared with WT, p values were <0.0001. |
Reprinted from Developmental Biology, 481, Stark, B.C., Gao, Y., Sepich, D.S., Belk, L., Culver, M.A., Hu, B., Mekel, M., Ferris, W., Shin, J., Solnica-Krezel, L., Lin, F., Cooper, J.A., CARMIL3 is important for cell migration and morphogenesis during early development in zebrafish, 148-159, Copyright (2021) with permission from Elsevier. Full text @ Dev. Biol.