
- Title
-
Glycosaminoglycan from Ostrea rivularis attenuates hyperlipidemia and regulates gut microbiota in high-cholesterol diet-fed zebrafish
- Authors
- Kong, Y., Li, Y., Dai, Z.R., Qin, M., Fan, H.L., Hao, J.G., Zhang, C.X., Zhong, Q.P., Qi, C., Wang, P.
- Source
- Full text @ Food Sci Nutr
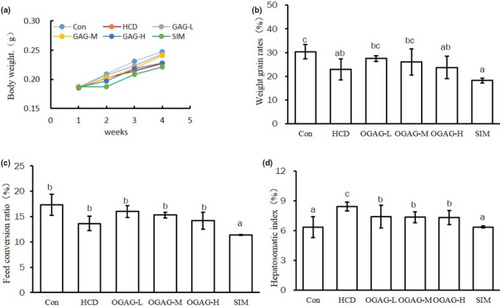
Effects of OGAG supplementation on growth parameters in zebrafish fed with a high‐fat diet for 4 weeks. (a) Relative body weight curves, (b) weight gain rate ((Final Weight‐Initial Weight)/Initial Weight × 100), (c) feed conversion rate was calculated by the formula (body weight gain/total feed intake × 100), and (d) hepatosomatic index was calculated by the formula (liver weight/body weight × 100). Data are expressed as the mean ± |
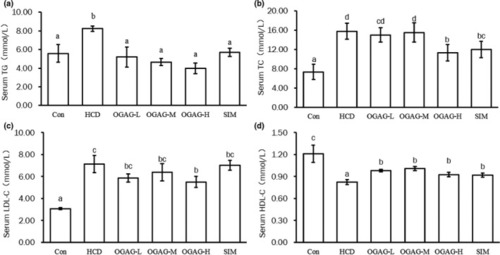
Effects of OGAG supplementation on serum lipid levels in zebrafish fed with high‐fat diets for 4 weeks. (a) Serum triglyceride concentration, (b) total cholesterol serum concentration, (c) low‐density lipoprotein cholesterol serum concentration, and (d) high‐density lipoprotein cholesterol serum concentration. Data are expressed as the mean ± |
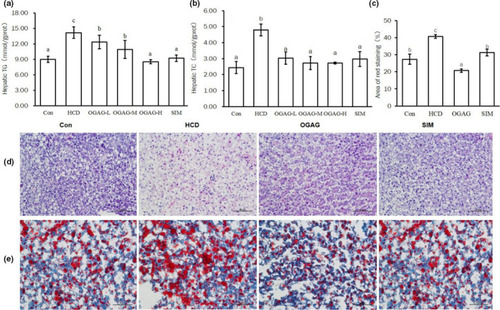
Effects of OGAG‐H on hepatic lipid accumulation in HCD‐fed zebrafish. (a) Hepatic triglyceride hepatic concentration and (b) total cholesterol hepatic concentration. Data are expressed as the mean ± |
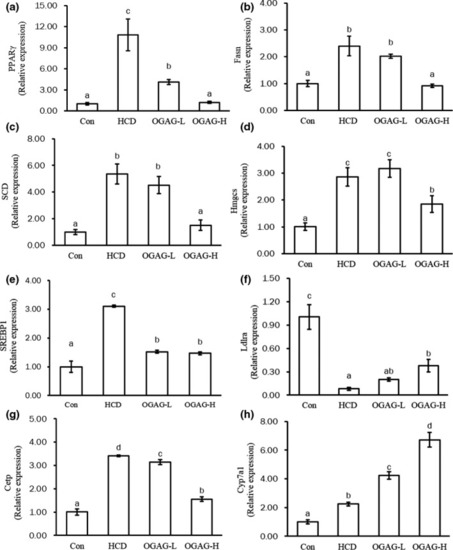
Effects of OGAG supplementation on the hepatic expression levels of genes related to lipid metabolism. (a) PPARγ, (b) FASN, (c) SCD, (d) HMGCS, (e) SREBP1, (f) CETP, (g) LDLRA, and (h) CYP7A1 in the hepatic tissue of high‐fat diet‐fed zebrafish by using RT‐qPCR. Data are expressed as the mean ± |

Differentially expressed genes analysis between the HCD and OGAG groups based on KEGG pathway data. Bubble chart shows enrichment of differentially expressed genes in signaling pathways. Y‐axis label represents pathway, and X‐axis label represents Gene Ratio (the number of genes in this entry is a percentage of all genes). Size and color of the bubble represent the amount of differentially expressed enriched in pathway, and the enrichment significance as the rich factor padj, respectively |
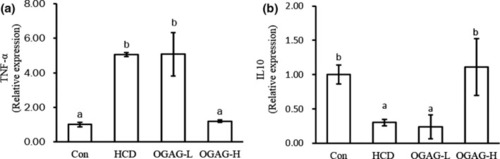
Effect of OGAG treatment on the expression levels of inflammatory cytokines in the hepatic tissue of HC diet‐fed zebrafish using RT‐qPCR. (a) Relative expression levels of TNF‐α and (b) relative expression levels of IL‐10. Data are expressed as the mean ± |
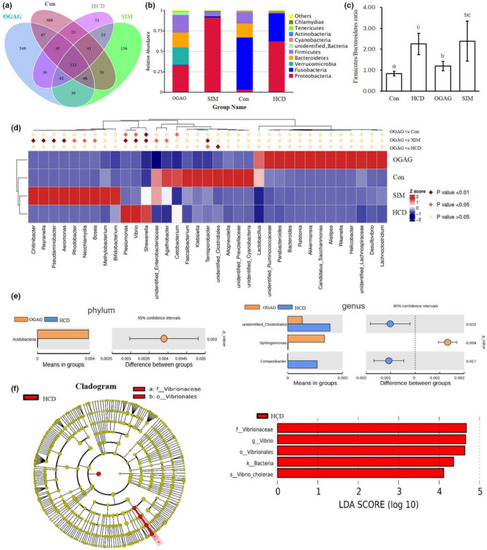
Effects of OGAG treatment on gut microbiota in the zebrafish fed with a high‐fat diets for 4 weeks. (a) Venn diagram of OTUs in the gut microbiota among the four groups, (b) relative abundances of the gut microbiota at the phylum level, (c) |
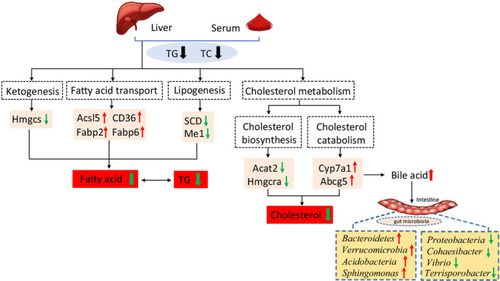
Suggested mechanisms for the attenuation of hyperlipidemia and regulation of gut microbiota by the glycosaminoglycan from |