
Image
|
Figure Caption
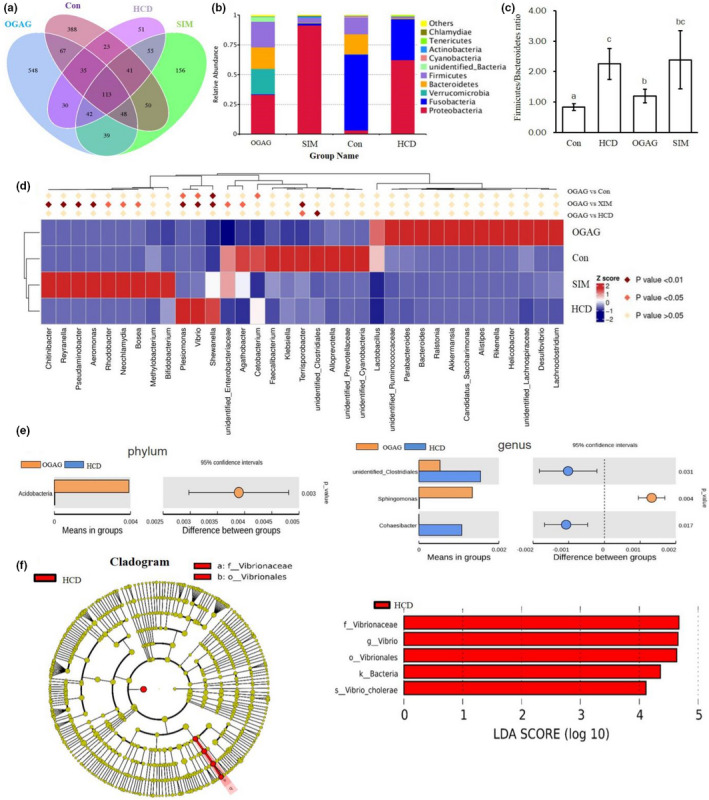
FIGURE 7
Effects of OGAG treatment on gut microbiota in the zebrafish fed with a high‐fat diets for 4 weeks. (a) Venn diagram of OTUs in the gut microbiota among the four groups, (b) relative abundances of the gut microbiota at the phylum level, (c)
Acknowledgments
This image is the copyrighted work of the attributed author or publisher, and
ZFIN has permission only to display this image to its users.
Additional permissions should be obtained from the applicable author or publisher of the image.
Full text @ Food Sci Nutr