
- Title
-
Selective CDK9 inhibition resolves neutrophilic inflammation and enhances cardiac regeneration in larval zebrafish
- Authors
- Kaveh, A., Bruton, F.A., Oremek, M.E.M., Tucker, C.S., Taylor, J.M., Mullins, J.J., Rossi, A.G., Denvir, M.A.
- Source
- Full text @ Development
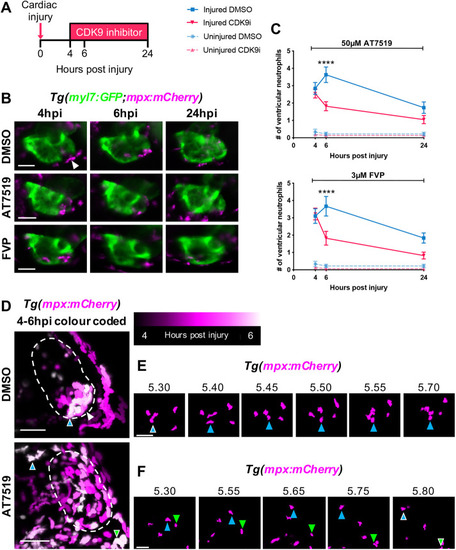
CDK9i treatment resolves neutrophil infiltration following cardiac injury by promoting reverse migration. (A) Experimental timeline indicating cardiac injury, CDK9i treatment and imaging time points. (B) Epifluorescence images of Tg(myl7:GFP;mpx:mCherry) larvae displaying neutrophil presence on the injured ventricle at 4 hpi (prior to treatment), and at 6 hpi and 24 hpi with 0.3% DMSO vehicle (top), 50 μM AT7519 (middle) or 3 μM FVP (bottom). Arrowhead indicates ventricular apex injury site marked by a loss of myocardial GFP and neutrophil accumulation. (C) Number of ventricular neutrophils at 4 hpi, 6 hpi and 24 hpi with 50 μM AT7519 (top) or 3 μM FVP (bottom) treatment. Error bars represent s.e.m., n=19 larvae, experimental n=3. ****P<0.0001 (two-way ANOVA and Bonferroni post-hoc test for comparisons between cardiac-injured DMSO vehicle or CDK9i treatment groups). (D) LSFM images of neutrophil (mpx:mCherry) migration temporally colour coded between 4 hpi and 6 hpi with 0.1% DMSO vehicle (top) or 50 μM AT7519 (bottom). Neutrophil positions appear as a different colour depending on the point in time (as indicated in the key). Dashed line indicates outline of ventricle. Coloured arrowheads indicate starting position of neutrophil (DMSO vehicle, blue arrowhead with white outline) or ending position of neutrophils (AT7519, blue and green arrowheads with white outline) relative to image panels in E and F, respectively. White arrowhead indicates ventricular apex injury site. (E) LSFM time-lapse-derived images of ventricular neutrophil migration with DMSO vehicle (0.1%); hpi indicated above each image. Blue arrowhead tracks an individual neutrophil migrating across the ventricular apex. (F) LSFM time-lapse-derived images of neutrophil migration from ventricle to pericardium with AT7519 (50 μM) treatment; hpi indicated above each image. Blue and green arrowheads track individual neutrophils reverse migrating anteriorly and posteriorly to the pericardium, respectively. LSFM fluorescence images were acquired in 3D and maximum intensity projections were used for temporal colour code analysis (D) or are individually displayed (E,F). Scale bars: 50 μm. |
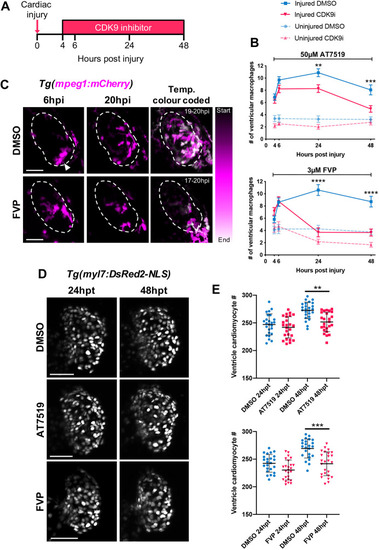
Continuous CDK9i treatment reduces macrophage retention on the injured ventricle and impairs cardiomyocyte number expansion. (A) Experimental timeline indicating cardiac injury, continuous CDK9i treatment and imaging time points. (B) Number of ventricular macrophages at 4 hpi, 6 hpi, 24 hpi and 48 hpi with ≤0.3% DMSO vehicle, 50 μM AT7519 (top) or 3 μM FVP (bottom) treatment. Error bars represent s.e.m., n=16 larvae, experimental n=3. **P<0.01, ***P<0.001, ****P<0.0001 (two-way ANOVA and Bonferroni post-hoc test for comparisons between cardiac-injured DMSO vehicle or CDK9i treatment groups). (C) LSFM time-lapse-derived images of cardiac-injured Tg(mpeg1:mCherry) larvae displaying ventricular macrophage presence at 6 hpi (left panel) and 20 hpi (middle panel) with 0.3% DMSO vehicle or 3 μM FVP. LSFM time-lapse images of macrophage (mpeg1:mCherry) migration temporally colour-coded with DMSO vehicle (0.3%) or FVP (3 μM) treatment (right). Start and end timepoint (hpi) for colour code is indicated. Dashed line indicates outline of ventricle. Arrowhead indicates ventricular apex injury site. (D) LSFM images of Tg(myl7:DsRed2-NLS) larvae displaying ventricular cardiomyocytes at 24 h hpt and 48 hpt with 0.3% DMSO vehicle (top), 50 μM AT7519 (middle) or 3 μM FVP (bottom). (E) Number of ventricular cardiomyocytes at 24 hpt and 48 hpt with ≤0.3% DMSO vehicle, 50 μM AT7519 (top) or 3 μM FVP (bottom). Error bars represent s.d., n=25 larvae, experimental n=3. **P<0.01, ***P<0.001 (one-way ANOVA and Tukey post-hoc test performed for comparisons between DMSO vehicle or CDK9i treatment groups). LSFM fluorescence images were acquired in 3D and maximum intensity projections are used for time point display (C,D) or temporal colour code analysis (C). Scale bars: 50 μm. |
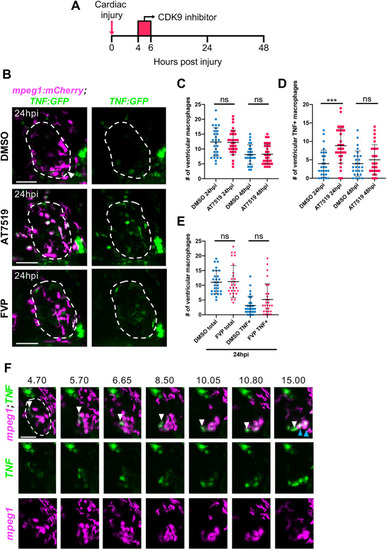
Transient CDK9i treatment does not affect cardiac macrophage numbers and AT7519 enhances wound macrophage tnf polarisation following injury. (A) Experimental timeline indicating cardiac injury, transient CDK9i treatment and imaging time points. (B) LSFM images of Tg(mpeg1:mCherry;TNFa:GFP) larvae displaying macrophage accumulation and tnf expression on the injured ventricle at 24 hpi following transient treatment with 0.3% DMSO vehicle (top), 50 μM AT7519 (middle) or 3 μM FVP (bottom). Arrowhead indicates ventricular apex injury site. (C,D) Number of ventricular macrophages (C) and ventricular tnf+ macrophages (D) at 24 hpi and 48 hpi following transient AT7519 (50 μM) treatment. (E) Number of ventricular macrophages (total and tnf+) at 24 hpi following transient FVP (3 μM) treatment. (C-E) Error bars represent s.d., n=28 larvae, experimental n=3. ***P<0.001 (one-way ANOVA and Tukey post-hoc test for comparisons between treatment groups). ns, non-significant. (F) LSFM time-lapse-derived images displaying macrophage migration and tnf expression on the injured ventricle, hpi indicated above each image. White arrowhead (top, all time points) tracks an individual tnf+ macrophage (mpeg1low) migrating to the ventricular apex. Blue arrowheads (top, 15.00 hpi) indicate two macrophages that have upregulated their tnf expression at the injured ventricular apex. LSFM fluorescence images were acquired in 3D and maximum intensity projections are displayed. Dashed line indicates outline of ventricle. Scale bars: 50 μm. |
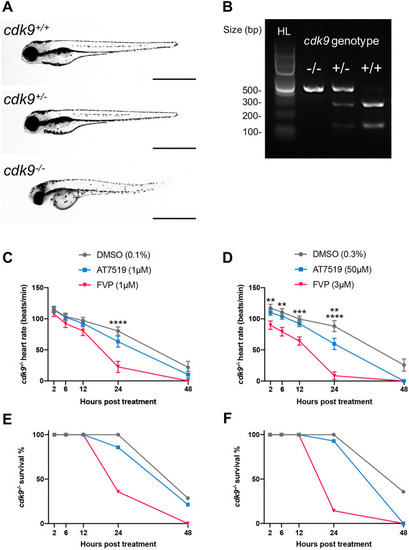
AT7519 is a more selective CDK9 inhibitor than FVP in zebrafish. (A) Brightfield images of a cdk9+/+ (top), cdk9+/− (middle) and cdk9−/− (bottom) whole zebrafish at 4 dpf. Scale bars: 1 mm. (B) Restriction enzyme digest gel displaying cdk9 genotypes of zebrafish larvae. Hyperladder (HL) band and individual genotype bands (in order: cdk9−/−, cdk9+/− and cdk9+/+) are indicated. (C,E) Heart rate (beats/min) (C) and percentage survival (E) of cdk9−/− larvae at 2 hpt, 6 hpt, 12 hpt, 24 hpt and 48 hpt with 0.1%, DMSO vehicle, 1 μM AT7519 or 1 μM FVP treatment. (D,F) Heart rate (beats/min) (D) and percentage survival (F) of cdk9−/− larvae at 2 hpt, 6 hpt, 12 hpt, 24 hpt and 48 hpt with 0.3% DMSO vehicle, 50 μM AT7519 or 3 μM FVP treatment. (C,D) Error bars represent s.e.m., n=15 larvae, experimental n=3. **P<0.01, ***P<0.001, ****P<0.0001 (two-way ANOVA and Bonferroni post-hoc test for comparisons between DMSO vehicle or CDK9i treatment groups). |
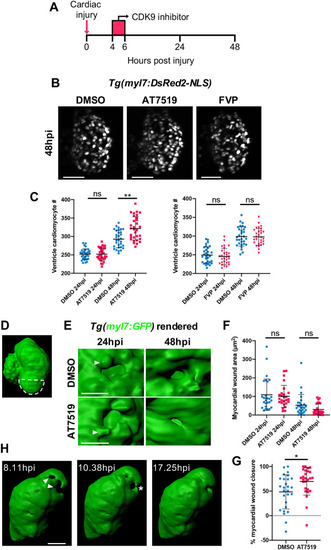
Transient AT7519 treatment enhances cardiomyocyte number expansion and accelerates the rate of myocardial regeneration following injury. (A) Experimental timeline indicating cardiac injury, transient CDK9i treatment and imaging time points. (B) LSFM images of Tg(myl7:DsRed2-NLS) larvae displaying ventricular cardiomyocytes at 48 hpi following transient treatment with 0.3% DMSO vehicle (left), 50 μM AT7519 (middle) or 3 μM FVP (right). (C) Number of ventricular cardiomyocytes at 24 hpi and 48 hpi following transient treatment with ≤0.3% DMSO vehicle, 50 μM AT7519 (left) or 3 μM FVP (right). Error bars represent s.d., n=29 larvae, experimental n=3. **P<0.01 (one-way ANOVA and Tukey post-hoc test for comparisons between DMSO vehicle or CDK9i treatment groups). (D) Surface-rendered LSFM image of a Tg(myl7:GFP) heart. Dashed line outlines the ventricular apex area that is subject to laser injury. (E) Surface-rendered LSFM image of a Tg(myl7:GFP) wound at the ventricular apex at 24 hpi and 48 hpi, following transient treatment with 0.1% DMSO vehicle (top) or 50 μM AT7519 (bottom). Arrowheads indicate cardiomyocyte protrusions adjacent to the wound (myl7:GFP negative). (F) Myocardial wound area (μm2) at 24 hpi and 48 hpi following transient treatment with 0.1% DMSO vehicle or 50 μM AT7519. Error bars represent s.d., n=27 larvae, experimental n=3. One-way ANOVA and Tukey post-hoc test performed for comparisons between treatment groups. (G) Myocardial wound closure (%) between 24 hpi and 48 hpi following transient treatment with 0.1% DMSO vehicle or 50 μM AT7519. Error bars represent s.d., n=27 larvae, experimental n=3. *P<0.05 (Mann–Whitney U-test for comparison between treatment groups). (H) Surface-rendered LSFM time-lapse-derived images of an injured myl7:GFP ventricle; hpi indicated. Arrowheads indicate myocardial wound (myl7:GFP negative). Asterisk indicates cardiomyocytes bridging across the myocardial wound (myl7:GFP negative). LSFM fluorescence images were acquired in 3D and maximum intensity projections (B) or 3D renders (D,E,H) are displayed. Scale bars: 50 μm (B,H); 20 μm (E). ns, non-significant. |
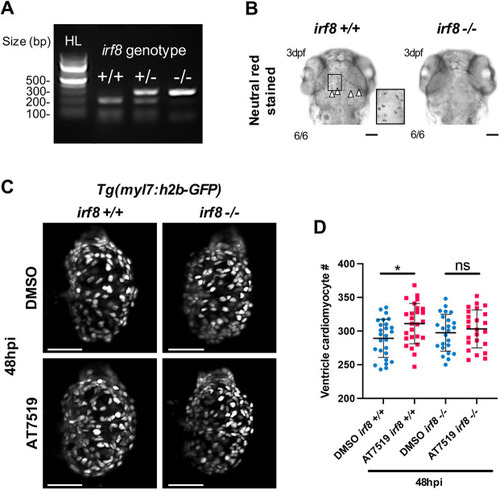
Macrophages are required for enhanced cardiomyocyte number expansion following cardiac injury and transient AT7519 treatment. (A) Restriction enzyme digest gel displaying irf8 zebrafish genotypes. Hyperladder (HL) band and individual genotype bands (in order: irf8+/+, irf8+/− and irf8−/−) are indicated. (B) Brightfield images of 3 dpf larval heads stained with Neutral Red showing macrophages/microglia in the brain of irf8+/+ larvae but not in irf8−/− larvae, with irf8−/− larvae devoid of all macrophages/microglia. Arrowheads indicate the presence of macrophages/microglia; inset shows a higher magnification of the boxed area. Scale bars: 500 μm. (C) LSFM images of irf8+/+ and irf8−/− Tg(myl7:h2b-GFP) larvae displaying ventricular cardiomyocytes at 48 hpi following transient treatment with 0.1% DMSO vehicle (top) or 50 μM AT7519 (bottom). Scale bars: 50 μm. (D) Number of ventricular cardiomyocytes at 48 hpi following transient treatment with 0.1% DMSO vehicle or 50 μM AT7519 in irf8+/+ and irf8−/− larvae. Error bars represent s.d., n=25 larvae, experimental n=3. *P<0.05 (one-way ANOVA and Tukey post-hoc test for comparisons between DMSO vehicle or AT7519 treatment groups). ns, non-significant. |