
- Title
-
Prrx1b restricts fibrosis and promotes Nrg1-dependent cardiomyocyte proliferation during zebrafish heart regeneration
- Authors
- de Bakker, D.E.M., Bouwman, M., Dronkers, E., Simões, F.C., Riley, P.R., Goumans, M.J., Smits, A.M., Bakkers, J.
- Source
- Full text @ Development

Heart regeneration and border zone cardiomyocyte proliferation is impaired in prrx1b−/− zebrafish. (A) AFOG staining on 30 dpi wild-type and prrx1b−/− heart sections showing fibrin in red, collagen in blue and remaining muscle tissue in orange. Scale bars: 100 μm. (B) Quantification of the remaining scar size at 30 dpi in prrx1b−/− hearts (n=6) and wild-type sibling hearts (n=9) (mean±s.d., P=0.0082, unpaired t-test). (C) AFOG staining on sections of 90 dpi hearts. Scars were completely resolved in wild-type hearts (n=12), whereas incomplete scar resolution was observed in prrx1b−/− four out of seven hearts. Scale bars: 100 μm. (D) Immunofluorescence staining on 7 dpi wild-type and prrx1b−/− heart sections using an anti-Mef2 antibody as a marker for cardiomyocyte nuclei, and an anti-PCNA antibody as a nuclear proliferation marker. Insets show higher magnifications of the boxed areas. Arrowheads indicate proliferating cardiomyocytes. Scale bars: 100 μm (main panels); 10 μm (insets). (E) Quantification of the percentage of proliferating (PCNA+) border zone cardiomyocytes in prrx1b−/− hearts (n=8) and wild-type sibling hearts (n=7) (mean±s.d., P<0.0001, unpaired t-test). |

Prrx1 is expressed in the epicardium/EPDCs and follows epicardial dynamics post-injury. (A) Schematic illustrating the experimental procedures. (B-F) Immunofluorescence staining on 1, 3, 7, 14 and 30 dpi tcf21:mCherry+ wild-type heart sections staining Prrx1 (green) and mCherry (magenta). Areas in the coloured boxes are shown at higher magnification below. Arrowheads indicate tcf21:mCherry+/Prrx1+ cells. Scale bars: 100 μm (low-magnification images); 10 μm (high-magnification images). BZ epicardium, border zone epicardium; Rm epicardium, remote epicardium. Six hearts analysed per condition. Dashed line indicates the border between myocardium and injury area. (G) Schematic of Prrx1 dynamics upon injury. Prrx1+ cells are in green. Dark colour at the apex represents the injury area. (H) Quantification of the distribution of tcf21:mCherry+/Prrx1+ cells per time point. Size of the dots represents the percentage of tcf21:mCherry+/Prrx1+ cells and absolute count number is visualized by a colour gradient. |
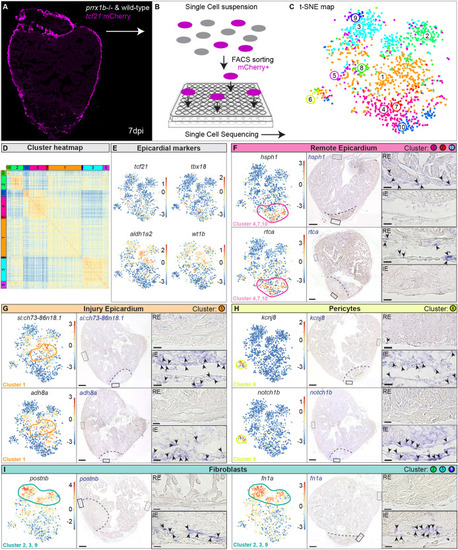
Single-cell sequencing identifies epicardial-derived cell populations in the injured zebrafish heart. (A,B) Workflow of the isolation (A) and sorting (B) of tcf21:mCherry+ cells in wild-type and prrx1b−/− hearts at 7 dpi. (C,D) tSNE plotting of the data results in ten transcriptionally distinct clusters (C), as also indicated by the heatmap (D). (E) tSNE maps visualizing log2-transformed read-counts for tcf21, tbx18, aldh1a2 and wt1b. (F-I) Characterization of the different cell clusters. Left: Panels show tSNE maps visualizing log2-transformed read-counts for genes with high expression in the indicated cluster (circled). Middle: In situ hybridization for the cluster-enriched genes in wild-type hearts at 7 dpi. Dashed line indicates injury border. Scale bars: 100 μm. Right: Magnifications of the boxed regions in remote (RE) and injury epicardium (IE) with arrowheads pointing to cells with high expression. Scale bars:10 μm. Three hearts analysed per condition. Gene lists are provided in Table S1. |

prrx1b−/− hearts contain excessive amounts of pro-fibrotic fibroblasts. (A) tSNE map of the single-cell sequencing data as shown in Fig. 3C, indicating ten transcriptionally distinct cell populations. (B) tSNE map showing the contribution of wild-type cells (cyan) and prrx1b−/− cells (red). (C) Stacked bar graph showing the relative cell contribution to major clusters in wild-type and prrx1b−/− hearts. (D) Pie charts showing the contribution of wild-type and prrx1b−/− cells per cluster. (E) Differential gene expression analysis using the DESeq algorithm between fibroblast clusters 2 and 3. Enriched genes were selected for either cluster 2 or 3 with a P-value cut-off of <0.05 (red). Gene Ontology analysis was performed using the online tool DAVID. Gene and full Gene Ontology lists are provided in Tables S2 and S3. (F,G) Characterization of cluster 3. Left: tSNE maps visualizing log2-transformed read-counts for genes with high expression in the indicated cluster (circled). Middle: In situ hybridization for the cluster 3-enriched genes in wild-type and prrx1b−/− hearts at 7 dpi. Dashed line indicates injury border. Scale bars: 100 μm. Right: Magnifications of the boxed regions in the injury area with arrowheads pointing to cells with high expression. Scale bars: 25 μm. Three hearts analysed per condition. (H) Sirius Red staining showing collagen in red on sections of wild-type and prrx1b−/− hearts at 7 dpi. Right-hand panels show magnifications of the boxed regions in the sub-epicardial layer and further inside the injury area. Scale bars:100 μm (left); 50 μm (right). (I) Quantification of Sirius Red (collagen) staining in wild-type (n=6) and prrx1b−/− (n=7) hearts showing significantly more fibrosis in prrx1b−/− hearts inside and around the injury area (mean±s.d., P=0.012, unpaired t-test). |

Prrx1b stimulates Nrg1 expression. (A) RNAscope in situ hybridization for nrg1 co-detected with Prrx1 antibody on 7 dpi wild-type hearts. Arrowheads indicate colocalization of nrg1 and Prrx1. Dashed line marks edge of the border zone. Insets show higher magnifications of the boxed areas. Scale bars: 100 μm (main panels); 10 μm (insets). Four hearts analysed. (B) RNAscope in situ hybridization for nrg1 on 7 dpi wild-type and prrx1b−/− hearts. Dashed line marks edge of the border zone. Insets show higher magnifications of the boxed areas. Scale bars: 100 μm (main panels); 10 μm (insets). (C) Quantification of nrg1 RNAscope dots in the BZ epicardium in 7 dpi wild-type (n=6) and prrx1b−/− (n=5) hearts. BZ epicardium is defined as a 100-μm-wide strip, 100 μm up and 100 μm down from where the edge of intact myocardium meets the epicardium (mean±s.d., P=0.0051, unpaired t-test). (D) Schematic of the workflow used for NRG1 injection experiments shown in E. (E) Quantification of the percentage of proliferating (PCNA+) BZ cardiomyocytes (mean±s.d., wild-type −NRG1 n=7; wild-type +NRG1 n=8; prrx1b−/− −NRG1 n=4; prrx1b−/− +NRG1 n=7; wild-type −NRG1 versus prrx1b−/−−NRG1 P=0.0118; prrx1b−/−−NRG1 versus prrx1b−/−+NRG1 P=0.0013; ns, not significant; one-way ANOVA followed by multiple comparisons analysis using Tukey's test). |
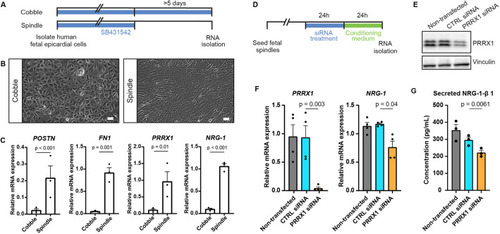
PRRX1 promotes NRG1 expression in human EPDCs. (A) Schematic of the workflow for the experiments shown in B and C. After isolation, human fetal epicardial cells are cultured in the presence of the ALK4/5/7 kinase inhibitor SB-431542. Cells transform from cobble- to spindle-shape upon removal of SB-431542. (B) Representative brightfield pictures of cobble- and spindle-shaped human fetal epicardial cells. Scale bars: 100 µm. (C) qPCR results for POSTN, FN1, PRRX1 and NRG1 in human fetal cobble (n=3) and spindle (n=3) epicardial cells (mean±s.d.; POSTN P<0.001, FN1 P=0.001, PRRX1 P=0.01, NRG1 P<0.001, unpaired t-tests). (D) Schematic of the workflow for the experiments shown in E and F. (E) Western blot for PRRX1 in U87 cells. Vinculin was used as a loading control. (F) qPCR results for PRRX1 and NRG1 in human fetal spindle epicardial cells after PRRX1 siRNA treatment (non-transfected cells n=4, CTRL siRNA n=4, PRRX1 siRNA n=4) (mean±s.d., PRRX1 CTRL siRNA versus PRRX1 siRNA P=0.003, NRG1 CTRL siRNA versus PRRX1 siRNA P=0.04, unpaired t-tests) (G) ELISA results for secreted NRG1-β1 in the conditioned cell culture medium of human fetal spindle epicardial cells between 24 and 48 h after PRRX1 siRNA treatment (non-transfected cells n=3, CTRL siRNA n=3, PRRX1 siRNA n=3) (mean±s.d., CTRL siRNA versus PRRX1 siRNA P=0.0061, unpaired t-tests). |