
|
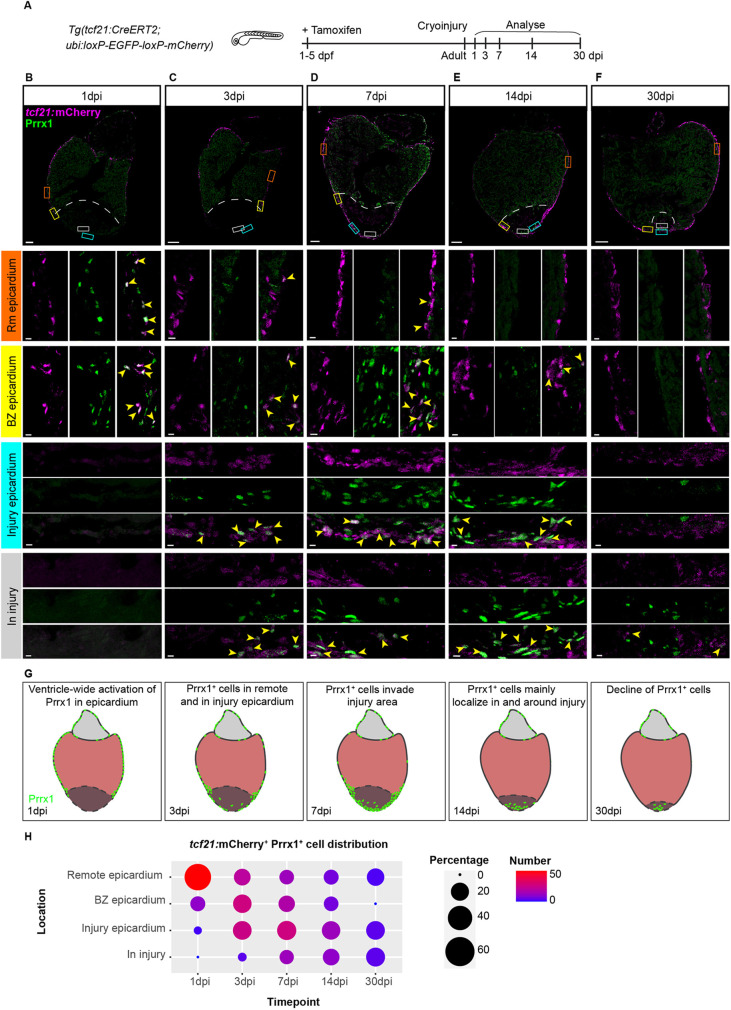
Fig. 2. Prrx1 is expressed in the epicardium/EPDCs and follows epicardial dynamics post-injury. (A) Schematic illustrating the experimental procedures. (B-F) Immunofluorescence staining on 1, 3, 7, 14 and 30 dpi tcf21:mCherry+ wild-type heart sections staining Prrx1 (green) and mCherry (magenta). Areas in the coloured boxes are shown at higher magnification below. Arrowheads indicate tcf21:mCherry+/Prrx1+ cells. Scale bars: 100 μm (low-magnification images); 10 μm (high-magnification images). BZ epicardium, border zone epicardium; Rm epicardium, remote epicardium. Six hearts analysed per condition. Dashed line indicates the border between myocardium and injury area. (G) Schematic of Prrx1 dynamics upon injury. Prrx1+ cells are in green. Dark colour at the apex represents the injury area. (H) Quantification of the distribution of tcf21:mCherry+/Prrx1+ cells per time point. Size of the dots represents the percentage of tcf21:mCherry+/Prrx1+ cells and absolute count number is visualized by a colour gradient.