
- Title
-
NudCL2 is an autophagy receptor that mediates selective autophagic degradation of CP110 at mother centrioles to promote ciliogenesis
- Authors
- Liu, M., Zhang, W., Li, M., Feng, J., Kuang, W., Chen, X., Yang, F., Sun, Q., Xu, Z., Hua, J., Yang, C., Liu, W., Shu, Q., Yang, Y., Zhou, T., Xie, S.
- Source
- Full text @ Cell Res.

Autophagic degradation of CP110 contributes to ciliogenesis.
a–f MEF cells with or without serum starvation (SS) were treated with 5 mM 3-MA, or 20 μM CQ for 24 h, and applied for the following analyses. Western analysis showed the protein levels of endogenous CP110, LC3 and p62 (a). β-actin was used as a loading control. Immunofluorescence analyses were carried out by using anti-CEP164 and anti-CP110 antibodies (b). CEP164, a marker of mother centrioles. Scale bar, 2 µm. The percentage of cells with CP110 dot at mother centrioles was calculated (c). Immunostaining of γ-tubulin and ADP ribosylation factor like GTPase 13b (Arl13b) in the indicated cells is shown (d). Arl13b and γ-tubulin are cilia and centrosome markers, respectively. The arrowheads indicate cilia. Scale bar, 10 µm. The cells with cilia were counted (e). Cilia length was also measured using ImageJ software (f). g–l Autophagy-deficient Atg5–/– or Atg7–/– MEF cells cultured with or without serum were subjected to the following analyses. Western blotting showed the levels of the indicated proteins (g). Immunofluorescence analyses were carried out by using anti-CEP164 and anti-CP110 antibodies (h). Scale bar, 2 µm. The percentage of cells with CP110 dot at mother centrioles was counted (i). Immunostaining of γ-tubulin and Arl13b in the indicated cells is shown (j). The arrowheads indicate cilia. Scale bar, 10 µm. The ciliated cells were calculated (k) and cilia length was determined using ImageJ software (l). Quantitative data are expressed as the means ± SD (at least three independent experiments). n, sample size. *P < 0.05, **P < 0.01, and ***P < 0.001; ns, not significant (P > 0.05); Student’s t-test. |

CP110 is associated with LC3 at mother centrioles.
a MEF cells transfected with GFP-CEP164 were cultured with or without serum for 24 h, treated with or without 20 μM CQ, and processed for immunostaining analysis with anti-CP110 and anti-LC3 antibodies. Scale bar, 2 µm. b–e MEF cells were starved for 24 h, treated with or without 20 μM CQ, stained with anti-CP110 and anti-LC3 antibodies, and subjected to FRET analysis by acceptor photobleaching. The LC3 dots were photobleached. Representative images of FRET experiments are shown (b, d). The dots with FRET-positive signals are labeled by white arrowheads. Scale bar, 0.5 µm. CP110 fluorescence intensities at daughter centrioles before (pre-) and after (post-) photobleaching are shown in starved cells (c). The quantification of changes in the CP110 fluorescence intensity at centrioles of starved cells with CQ treatment after photobleaching is presented (e). f, g MEF cells cultured with serum were processed for co-IP analysis with anti-CP110 (f) or anti-LC3 (g) antibodies. h In vitro interaction of purified GST-LC3 with His-CP110. Quantitative data are expressed as the means ± SD (at least three independent experiments). n, sample size. ns, not significant (P > 0.05); Student’s t-test. |

NudCL2 mediates the interaction between LC3 and CP110.
a GST pull-down analyses of purified GST-NudCL2 with His-CP110. b GST pull-down analyses of purified GST-LC3 with His-NudCL2. c In vitro protein interaction of purified GST-LC3 with His-CP110 and His-NudCL2. d, e Wild-type (WT) and NudCL2 knockout (KO-1) MEF cells were applied for co-IP analysis with anti-CP110 or anti-LC3 antibodies, respectively. 3% of total input is shown. f–j WT and NudCL2 KO MEF cells were transfected with the indicated plasmids, cultured with or without serum for 24 h, and processed for the following analyses. Western blot analysis showed the expression of the indicated proteins (f, g). β-actin was used as a loading control. Immunofluorescence analyses were carried out by using anti-CEP164 and anti-CP110 antibodies (h). Scale bar, 2 µm. The percentage of cells with CP110 dots at mother centrioles was calculated (i, j). k Schematic diagram shows the possible LIR motifs (W/F/YxxL/I/V) of NudCL2. The point mutations (depicted in red) in four putative LIR motifs are defined as M1, M2, M3, and M4, respectively. l MEF cells transfected with the indicated plasmids were subjected to co-IP experiments. 3% of total input is shown. m GST pull-down analysis of purified GST-LC3 with His-NudCL2 or His-M2. n In vitro protein interaction of purified GST-LC3 with His-CP110 and His-NudCL2 or His-M2. Quantitative data are expressed as the means ± SD (at least three independent experiments). n, sample size. *P < 0.05 and **P < 0.01; Student’s t-test. |

NudCL2 and CP110 are removed from mother centrioles during ciliogenesis.
a MEF cells were cultured with or without serum starvation, treated with or without 20 μM CQ, and subjected to immunofluorescence analysis with anti-NudCL2 and anti-CEP164 antibodies. b MEF cells were transfected with GFP-NudCL2 and applied for immunofluorescence analysis with anti-CP110 and anti-CEP164 antibodies under the indicated treatments. c MEF cells transfected with GFP-NudCL2 were stained with anti-LC3 and anti-CEP164 antibodies under the indicated treatments. d–h MEF cells treated with or without 20 μM CQ were starved for different times, and then subjected to immunostaining analyses with the indicated antibodies. The percentages of ciliated cells (e), cells with CP110 dot at mother centrioles (f), cells with NudCL2 dot at mother centrioles (g), and cells with LC3-positive puncta at mother centrioles (h) are shown. Scale bars, 2 µm. |
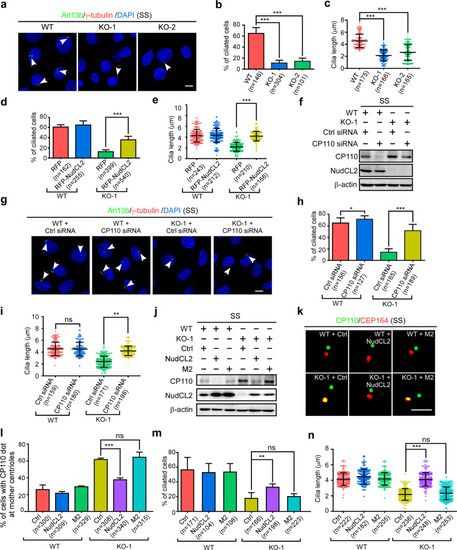
NudCL2 facilitates ciliogenesis by mediating CP110 degradation at mother centrioles.
a–c WT and NudCL2 KO MEF cells were starved for 24 h, and subjected to the following analyses. Immunostaining of cells with anti-Arl13b and anti-γ-tubulin antibodies is shown (a). Scale bar, 10 µm. DNA was visualized using DAPI. The proportion of cells with cilia was calculated (b), and cilia length was measured using ImageJ software (c). d, e WT and NudCL2 KO MEF cells transfected with the indicated plasmids were cultured without serum for 24 h. The ciliated cells were counted (d). Cilia length was determined using ImageJ software (e). f–i WT and NudCL2 KO MEF cells treated with the indicated siRNAs were starved for 24 h, and subjected to the following analyses. Western blotting showed the expression of CP110 and NudCL2 (f). β-actin, a loading control. Immunofluorescence analysis was carried out by using anti-Arl13b and anti-γ-tubulin antibodies (g). Cilia are indicated by white arrows. Scale bar, 10 µm. DNA was stained by DAPI. The ciliated cells were counted (h) and cilia length was measured using ImageJ software (i). j–n WT and NudCL2 KO MEF cells infected with the indicated lentiviruses were cultured without serum for 24 h, and processed for the following analyses. Western blot analysis revealed NudCL2 and CP110 expression (j). Immunofluorescence analyses were carried out with anti-CEP164 and anti-CP110 antibodies (k). Scale bar, 2 µm. The percentage of cells with CP110 dots at mother centrioles was counted (l). The percentage of cells with cilia was calculated (m). Cilia length was also determined using ImageJ software (n). Quantitative data are expressed as the means ± SD (at least three independent experiments). n, sample size. *P < 0.05, **P < 0.01, and ***P < 0.001; ns, not significant (P > 0.05); Student’s t-test. |
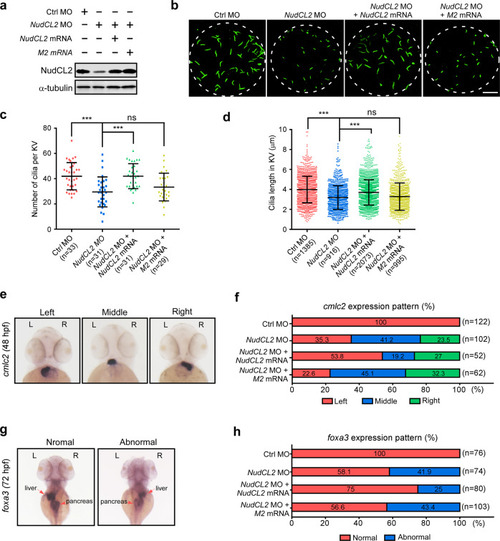
NudCL2 is essential for ciliogenesis during zebrafish development.
Embryos were injected with the indicated MOs and mRNAs, and collected at different times. a Western blot analysis of NudCL2 expression. α-tubulin was used as a loading control. b Immunofluorescence of cilia in KVs with anti-acetylated-α-tubulin antibody (green) at 6–8 somite stages. Scale bar, 10 µm. c, d Cilia number per KV was calculated and cilia length was measured using ImageJ software. e–h Whole-mount in situ hybridization with cmlc2 probe at 48 hpf or foxa3 probe at 72 hpf. Liver and pancreas are indicated by arrows and arrowheads, respectively. Quantification of the expression patterns of cmlc2 or foxa3 is shown (f, h). The data are presented as means ± SD derived from at least three independent experiments. n, sample size. ***P < 0.001; ns, not significant (P > 0.05); Student’s t-test. EXPRESSION / LABELING:
PHENOTYPE:
|
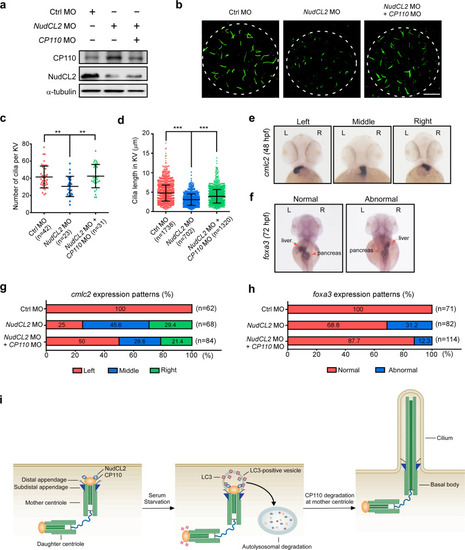
Knockdown of CP110 reverses the ciliary defects in NudCL2 morphants.
Embryos were injected with the indicated MOs and harvested at different times. a Immunoblot analysis of NudCL2 and CP110 expression. α-tubulin, a loading control. b–d Immunofluorescence of cilia with anti-acetylated-α-tubulin antibody in KVs at 6–8 somite stages (b). Scale bar, 10 µm. The cilia number per KV was calculated (c). Cilia length in KV was measured using ImageJ software (d). e–h Whole-mount in situ hybridization with cmlc2 probe (48 hpf) and foxa3 probe (72 hpf). Liver and pancreas are indicated by arrows and arrowheads, respectively. The percentage of the expression patterns of cmlc2 and foxa3 was calculated (g, h). The data are presented as means ± SD derived from at least three independent experiments. n, sample size. **P < 0.01 and ***P < 0.001 Student’s t-test. i Working model of NudCL2-mediated autophagic degradation of CP110 at mother centrioles to initiate ciliogenesis. See text for details. EXPRESSION / LABELING:
PHENOTYPE:
|