FIGURE SUMMARY
Title

Inhibitory Role of an Aeromonas hydrophila TIR Domain Effector in Antibacterial Immunity by Targeting TLR Signaling Complexes in Zebrafish

Authors
Tang, H.P., Huang, C., Hu, C.B., Li, H., Shao, T., Ji, J.F., Bai, J., Fan, D.D., Lin, A.F., Xiang, L.X., Shao, J.Z.
Source
Full text @ Front Microbiol

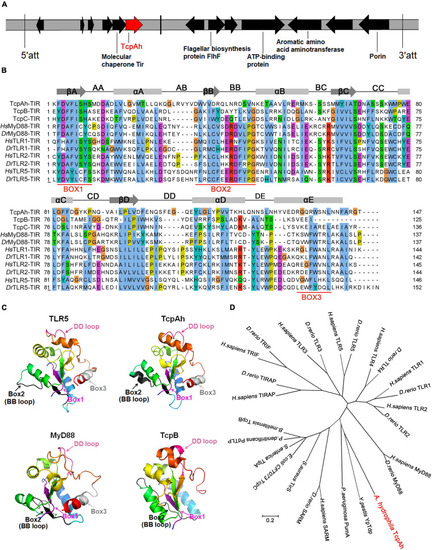
Bioinformatic characterization of TcpAh-encoding gene and protein in A. hydrophila JBN2301 strain. (A) Localization of TcpAh-encoding gene in JBN2301 genome. The encoding sequence of TcpAh is indicated in red arrow and att means attachment site. (B) Sequence alignment of TIR domains using Jalview/ClustalW and ClustalX programs. Conserved functional motifs and amino acid residues are shaded in different colors. Secondary structures were predicted by Jalview/Jpred program. Gray boxes, gray arrows, and black lines denote alpha helices, beta-sheet areas, and connecting loops, respectively. (C) Prediction of the 3D structures of TIR domains using Phyre server and PyMol program. The TcpAh TIR domain (38–184 aa) was modeled with 100% confidence by the single highest scoring template as the TIR domain of TLR5 (PDB c3j0aA). Box 1 (purple), box 2 and BB loop (black), and box 3 and DD loop (hot pink) are indicated within the TIR domains. (D) Phylogenetic trees of the amino acid sequences of TcpAh and its homologs in other species constructed by neighbor-joining method using MEGA 7.0. The tree was drawn to scale, and branch lengths are in the same units as those of the evolutionary distances used to infer the phylogenetic tree. The evolutionary distances were computed using the p-distance method. The GenBank accession numbers of the sequences are as follows: H. sapiens MyD88, AAC50954.1; D. rerio MyD88, AAQ91324.1; H. sapiens TLR1, NP_891549.1; D. rerio TLR1, AAI63271.1; H. sapiens TLR2, AAY85648.1; D. rerio TLR2, NP_997977.1; H. sapiens TLR3, NP_003256.1; D. rerio TLR3, AAI07956.1; H. sapiens TLR4, NP_003257.1; D. rerio TLR4, NP_001315534.1; H. sapiens TLR5, NP_003259.2; D. rerio TLR5, NP_001124067.2; H. sapiens TRIF, AAH09860.2; D. rerio TRIF, NP_001038224.1; H. sapiens TRIAP, NP_001034750.1; D. rerio TRIAP, XP_002667158.2; H. sapiens SARM, NP_055892.2; D. rerio SARM, NP_001124068.1; Y. pestis YpTdp, WP_198249346.1; A. hydrophila TcpAh, WP_043158960; P. aeruginosa PumA, WP_012075302.1; S. aureus TirS, WP_000114516.1; E. coli CFT073 TcpC, WP_000282336.1; S. enterica TlpA, WP_079786625.1; P. denitrificans PdTLP, QAR27511.1; B. melitensis TcpB, EPZ76643.1.

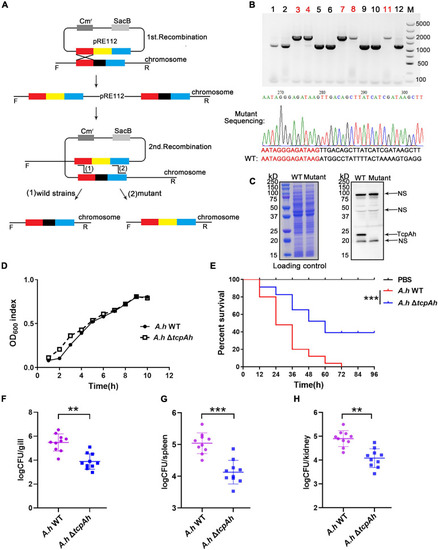
Examination of the requirement of TcpAh for A. hydrophila infection. (A) Strategy for the deletion of the tcpAh gene in A. hydrophila JBN2301 strain by homologous recombination. The black block indicates the tcpAh gene; red and blue blocks indicate the left and right homologous sequences of the tcpAh gene, respectively; and the yellow block indicates the Tcr gene. (B) PCR and sequencing identification of the mutant strain with tcpAh gene deletion (ΔtcpAh). The lanes with red number indicate the mutant strain; partial sequencing result is showed. (C) Western blot analysis of TcpAh protein in wild-type and mutant A. hydrophila JBN2301 strains in liquid cultures and NS means non-specific band. The total proteins of wild-type and ΔtcpAh A. hydrophila JBN2301 strains were separated by SDS-PAGE and stained with Coomassie brilliant blue R250 as a loading control. The TcpAh protein was detected by using a polyclonal rabbit anti-TcpAh antibody with an expected molecular weight of 22 kDa. (D) Growth curve of wild-type and ΔtcpAh A. hydrophila JBN2301 strains. (E) Zebrafish survival curve. Zebrafish were infected with wild-type A. hydrophila JBN2301 and ΔtcpAh mutant. Statistical differences between wild-type versus ΔtcpAh A. hydrophila infected groups were analyzed by log-rank test. n = 25. ***p < 0.001. Group of fish injected with mock PBS was used as a negative control. (F–H) Examination of bacterial load in the (F) gill, (G) spleen, and (H) kidney tissues of zebrafish infected with wild-type and ΔtcpAh mutant A. hydrophila JBN2301 strains. Non-parametric two-tailed Mann–Whitney test was carried out with (F)∗∗p < 0.01, (G)***p < 0.001, and (H) **p < 0.01.

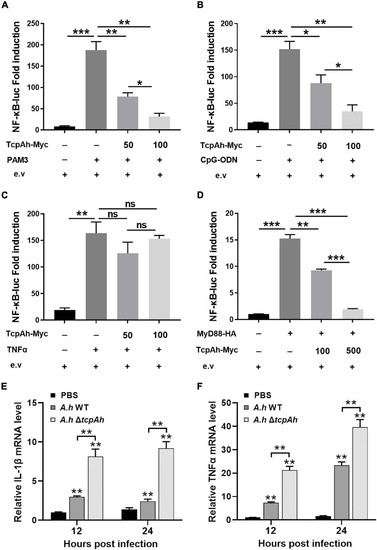
Examination of the inhibitory role of TcpAh in MyD88 signaling pathway. (A–C) Activation of the NF-κB-binding promoters detected in zebrafish embryos microinjected with NF-κB luciferase reporter (NF-κB-Luc; 100 pg/embryo), renilla luciferase reporter (10 pg/embryo), and increasing amounts (0, 50, and 100 pg/embryo) of TcpAh expression vectors with stimulation of (A) Pam3CSK4 (200 pg/embryo), (B) CpG-ODN (400 pg/embryo), and (C) TNFα (10 pg/embryo) for 12 h. Data are the average luciferase activity ± SD (*p < 0.05; **p < 0.01; ***p < 0.001; ns, not significant). (D) Activation of the NF-κB-binding promoter detected in HEK293T cells transfected with NF-κB luciferase reporter (NF-κB-Luc; 150 ng/mL), renilla luciferase reporter (15 ng/mL), MyD88 expression vector (50 ng/mL), and increasing amounts (0, 100, and 500 ng/mL) of TcpAh expression vectors. Data are the average luciferase activity ± SD (**p < 0.01; ***p < 0.001). (E,F) Real-time PCR analysis for the expression of zebrafish IL-1β (E) and TNFα (F) in leukocytes, which were sorted from peripheral blood, spleen, and kidney tissues at indicated time after i.p. stimulation with PBS, wild-type A. hydrophila and ΔtcpAh mutant. Data are representative of three independent experiments as mean ± SD (**p < 0.01). Standard loading was indicated by β-actin expression.

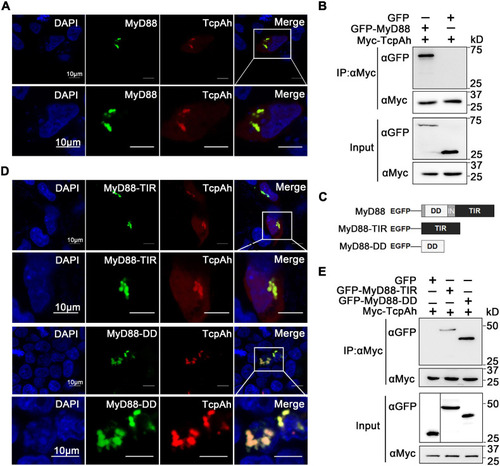
Interaction between TcpAh and MyD88 by TIR–TIR and TIR–DD interactions. (A) Co-localization analysis of TcpAh and zebrafish MyD88 proteins in HEK293T cells by confocal microscopy (Zeiss LSM 710; original magnification, 630×). The nucleus was stained with DAPI. Scale bars correspond to 10 μm. (B) Co-IP analysis between TcpAh and zebrafish MyD88 proteins from HEK293T cells expressing Myc-TcpAh with GFP or GFP-MyD88. (C) Schematic diagram of wild-type and domain-truncated zebrafish MyD88 forms. (D) Co-localization analysis between TcpAh and truncated MyD88 proteins in HEK293T cells by confocal microscopy (Zeiss LSM 710; original magnification, 630×). The nucleus was stained with DAPI. Scale bars correspond to 10 μm. (E) Co-IP assay between TcpAh and MyD88-TIR domain (148–284 aa) or MyD88-DD domain (11–101 aa) as shown in (B), except MyD88-TIR or MyD88-DD was used instead of full-length wild-type MyD88.

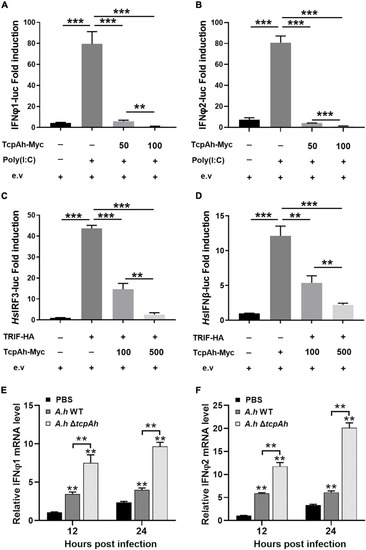
Examination of the inhibitory role of TcpAh in TRIF signaling pathway. (A,B) Activation of zebrafish IFNφ1/IFNφ2 promoters detected in zebrafish embryos microinjected with IFNφ1 or IFNφ2 luciferase reporter (IFNφ1 or IFNφ2-Luc; 100 pg/embryo), renilla luciferase reporter (10 pg/embryo), and increasing amounts (0, 50, and 100 pg/embryo) of TcpAh expression vectors under stimulation with PolyI:C (200 pg/embryo) for 12 h. Data are the average luciferase activity ± SD (**p < 0.01; ***p < 0.001). (C,D) Activation of human IRF3 and IFN-β promoters in HEK293T cells transfected with human IRF3 or IFN-β luciferase reporter (IRF3-Luc or IFN-β-Luc; 200 ng/mL), renilla luciferase reporter (15 ng/mL), zebrafish TRIF expression vector (50 ng/mL), and increasing amounts (0, 100, and 500 ng/mL) of TcpAh expression vectors. Data are the average luciferase activity ± SD (**p < 0.01; ***p < 0.001). (E,F) Real-time PCR analysis for the expression of zebrafish IFNφ1 (E) and IFNφ2 (F) in leukocytes, which were sorted from peripheral blood, spleen, and kidney tissues at indicated time after i.p. stimulation with PBS, wild-type A. hydrophila and ΔtcpAh mutant. Data are representative of three independent experiments as mean ± SD (**p < 0.01). Standard loading was indicated by β-actin expression.

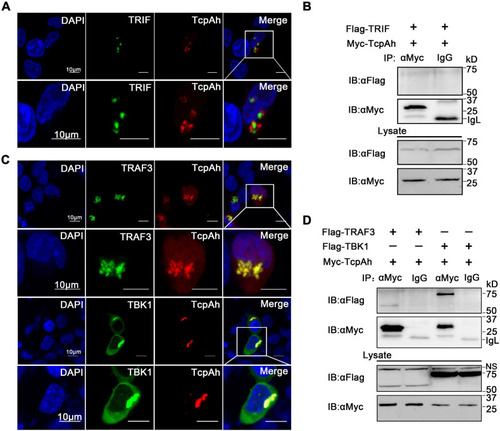
Examination of the associations of TcpAh with TRAF3 and TBK1. (A) Co-localization analysis of TcpAh and zebrafish TRIF protein in HEK293T cells by confocal microscopy (Zeiss LSM 710; original magnification, 630×). The nucleus was stained with DAPI. Scale bars correspond to 10 μm. (B) Co-IP analysis between TcpAh and zebrafish TRIF proteins from HEK293T cells expressing Myc-TcpAh with Flag-TRIF. (C) Co-localization analysis of TcpAh and zebrafish TRAF3 or TBK1 proteins in HEK293T cells by confocal microscopy (Zeiss LSM 710; original magnification, 630×). The nucleus was stained with DAPI. Scale bars correspond to 10 μm. (D) Co-IP analysis between TcpAh and zebrafish TRAF3 or TBK1 proteins from HEK293T cells expressing Myc-TcpAh with Flag-TRAF3 or Flag-TBK1.

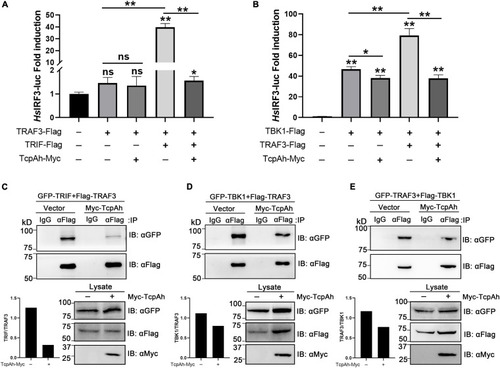
Examination of the functional role of TcpAh in preventing TRIF–TRAF3 and TRAF3–TBK1 interactions. (A,B) Activation of human IRF3 promoter in HEK293T cells transfected with human IRF3 luciferase reporter (HsIRF3-Luc; 200 ng/mL), renilla luciferase reporter (15 ng/mL), and (A) zebrafish TRAF3 expression vector (50 ng/mL) alone or in combination with zebrafish TRIF expression vector (50 ng/mL) with or without TcpAh expression vector (500 ng/mL) or (B) zebrafish TBK1 expression vector (50 ng/mL) alone or in combination with a zebrafish TRAF3 expression vector (50 ng/mL) with or without TcpAh expression vector (500 ng/mL). Data are the average luciferase activity ± SD (*p < 0.05; **p < 0.01; ns, not significant). (C–E) Co-IP analysis showing the inhibition of TRIF–TRAF3 and TRAF3–TBK1 interactions by TcpAh in HEK293T cells transfected with plasmids in indicated combinations.

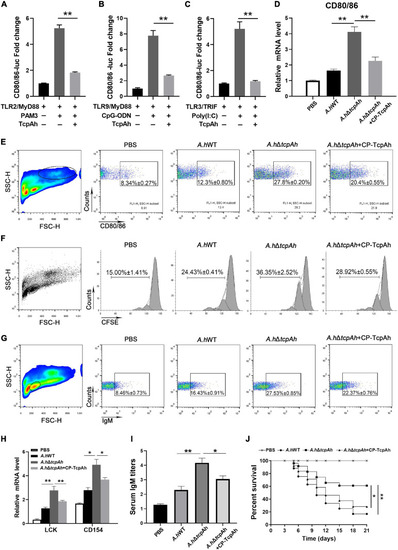
Examination of the inhibitory role of TcpAh in zebrafish adaptive humoral immunity against infection by repressing CD80/86 expression. (A–C) Activation of zebrafish CD80/86 promoter in HEK293T cells transfected with CD80/86 luciferase reporter (CD80/86-Luc; 200 ng/mL), renilla luciferase reporter (15 ng/mL) and expression vectors for zebrafish TLR2 or TLR9 or TLR3 (20 ng/mL) in combination with MyD88 or TRIF (20 ng/mL) with or without TcpAh expression vector (250 ng/mL). After 24 h, the HEK293T cells were stimulated with PAM3 or CpG-ODN or Poly(I:C) for 12 h. Data are the average luciferase activity ± SD (**p < 0.01; ***p < 0.001). (D) Real-time PCR analysis for the expression of zebrafish cd80/86 in leukocytes, which were sorted from peripheral blood, spleen, and kidney tissues 2 days after i.p. stimulation with PBS, wild-type A. hydrophila, ΔtcpAh mutant, or ΔtcpAh mutant complemented with CP-TcpAh protein. Data are representative of three independent experiments as mean ± SD (*p < 0.05; **p < 0.01). (E) Flow cytometric analysis of CD80/86 expression level on MHC-II+ antigen-presenting cells (APCs) of each in vivo treatment group. Data are representative of three independent experiments as mean ± SD (*p < 0.05; **p < 0.01). (F) Proliferation of lymphocytes determined by CFSE dilution through flow cytometry under the indicated experimental treatment. (G) Proliferation of IgM+ B cells determined by flow cytometry under the indicated experimental treatment. Data are representative of three independent experiments as mean ± SD (*p < 0.05; **p < 0.01). (H) Real-time PCR analysis of the expression levels of zebrafish LCK and CD154 of each in vitro treatment group. Data are representative of three independent experiments as mean ± SD (*p < 0.05; **p < 0.01). (I) Examination of the inhibitory role of TcpAh in IgM production in response to A. hydrophila infection in each treatment group by ELISA. Data are representative of three independent experiments as mean ± SD (n = 20; *p < 0.05; **p < 0.01). (J) Examination of the inhibitory role of TcpAh in zebrafish defense against A. hydrophila infection. Zebrafish were infected with A. hydrophila ΔtcpAh or with wild-type A. hydrophila or with A. hydrophila ΔtcpAh complement with CP-TcpAh. Differences were analyzed using log-rank test (*p < 0.05; **p < 0.01). Group of fish injected with mock PBS was used as a negative control.

Acknowledgments
This image is the copyrighted work of the attributed author or publisher, and ZFIN has permission only to display this image to its users. Additional permissions should be obtained from the applicable author or publisher of the image. Full text @ Front Microbiol