FIGURE SUMMARY
Title

Obesity Causes Abrupt Changes in the Testicular Microbiota and Sperm Motility of Zebrafish

Authors
Su, Y., He, L., Hu, Z., Li, Y., Zhang, Y., Fan, Z., Zhao, K., Zhang, H., Liu, C.
Source
Full text @ Front Immunol

Successful establishment of the obesity model. (A) Male zebrafish appearance in control and obese groups. A clearly larger abdomen can be seen in zebrafish in the obese group as shown by the dark blue arrow. (B, C) Measurement of body weight and length of zebrafish before and after exposure. (D) Significant differences in the BMI index. (E) Expression of subcutaneous fat in zebrafish (scale bar = 100 μm). (F) Expression of fat droplets in the liver (scale bar = 100 μm). (G, H) Determination of cholesterol in the blood and detection of blood glucose. Values are mean ± SME (n = 5). The asterisk represents a statistically significant difference when compared with the controls; *, ** and **** at P < 0.05, P < 0.01 and P < 0.0001, respectively.

Effects of obesity on the sperm motility of zebrafish. (A) Intuitive CASA image of zebrafish sperm movement under a microscope. (B) Sperm MOT between the two groups. (C–E) Percentage of motile VAP and progressive VAP (%) of adult zebrafish. (F) Comparison of sperm morphology between the two groups under the electron microscope. (G) The obese group had lesions on the head of the sperm as shown by the red arrow. Data represent mean ± SME (n = 6). *, ** and *** at P < 0.05, P < 0.01 and P < 0.001, respectively.

Obesity causes the destruction of zebrafish BTB structure and testicular inflammation. (A) Testicular HE staining in the control and obese groups. Yellow stars indicate sperm vesicles of the same type of spermatogenic cells in the zebrafish testis, and the red arrow indicates the interstitial part. Obviously, the zebrafish spermatogenic cells were disorderly arranged, and the interstitium was thickened. (B) Ultrastructure of zebrafish BTB. Red boxes indicate connections between Sertoli cells and germ cells in zebrafish testis. In the enlarged image, the BTB structure of the obese group is damaged, as shown by the red arrow. (C) Detection of testosterone in the blood. The testosterone level of the obese group was markedly decreased (P < 0.001). (D) Effects of ODP exposure on the mRNA levels of tnf-α, il-1β, and il-8 in zebrafish testis. (E) Detection of IL-1β expression in the blood by ELISA. Data represent mean ± SME (n = 5). The asterisk represents a statistically significant difference when compared with the corresponding controls; *, ** and *** at P < 0.05, P < 0.01 and P < 0.001, respectively.

Differences in intestinal microbial composition after High-fat diet-induced obesity. (A) Composition of intestinal microbial communities in the control and obese groups. (B) Venn plot population analysis results in gut microbes between the control and obese groups. (C) LEfSe multi-level species discriminant analysis using non-parametric factorial Kruskal–Wallis rank sum test and LDA to find groups that significantly differ in abundance. Data represent mean ± SME (n = 3).

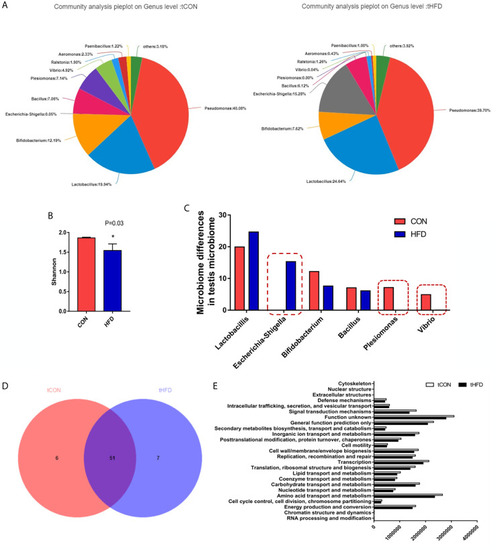
Microbial community composition analysis in the testes of normal and obese male zebrafish showing marked microbial differences between the two groups. (A) The pie chart shows the community species composition information of testicular microbes at the gate level in the control and HFD groups. (B) Shannon diagram of alpha diversity analysis of testicular microorganisms (P = 0.03). (C) Analysis and selection of dominant strains of testicular microbial communities that were markedly differently expressed in the two groups. (D) Venn plot population analysis results between the two groups. (E) Predictive analysis of microbiota function. Data represent mean ± SME (n = 3). * at P < 0.05.

Comparison between testicular and intestinal microorganisms. (A) Analysis of the microbial community composition of the testis and intestinal samples in the control and obese groups. The histogram results show that the dominant species are the same at the gate level for different samples, but the relative abundance is different. (B) The heatmap shows the species composition and sample cluster tree analysis of 50 species of bacterial communities in the testis and intestinal tracts of different groups at the genus level. Red indicates high bacterial abundance, whereas blue indicates low abundance. Data represent mean ± SME (n = 3).

Acknowledgments
This image is the copyrighted work of the attributed author or publisher, and ZFIN has permission only to display this image to its users. Additional permissions should be obtained from the applicable author or publisher of the image. Full text @ Front Immunol