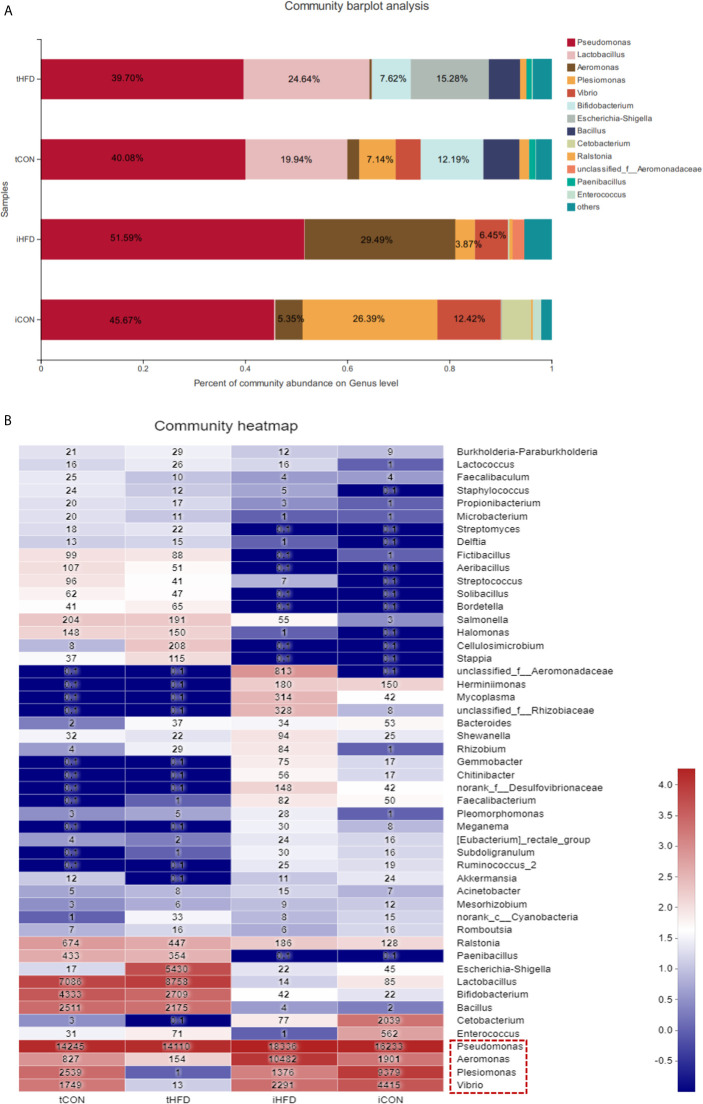
IMAGE

Figure 6

ID
ZDB-IMAGE-210716-25
Source
Figures for Su et al., 2021
Image
Figure Caption

Figure 6

Comparison between testicular and intestinal microorganisms. (A) Analysis of the microbial community composition of the testis and intestinal samples in the control and obese groups. The histogram results show that the dominant species are the same at the gate level for different samples, but the relative abundance is different. (B) The heatmap shows the species composition and sample cluster tree analysis of 50 species of bacterial communities in the testis and intestinal tracts of different groups at the genus level. Red indicates high bacterial abundance, whereas blue indicates low abundance. Data represent mean ± SME (n = 3).

Acknowledgments
This image is the copyrighted work of the attributed author or publisher, and ZFIN has permission only to display this image to its users. Additional permissions should be obtained from the applicable author or publisher of the image. Full text @ Front Immunol