FIGURE SUMMARY
Title

Characterization of a member of the CEACAM protein family as a novel marker of proton pump-rich ionocytes on the zebrafish epidermis

Authors
Kowalewski, J., Paris, T., Gonzalez, C., Lelièvre, E., Castaño Valencia, L., Boutrois, M., Augier, C., Lutfalla, G., Yatime, L.
Source
Full text @ PLoS One

Schematic representation of the domain organization of the 12 human CEACAM receptors and of zebrafish CEACAMz1.

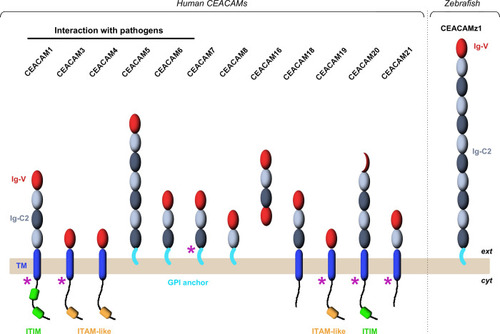
Immunoglobulin domains composing the CEACAM ectodomains are displayed as oval spheres (in red for Ig-V domains; in light or dark grey for A-type or B-type Ig-C2 domains, respectively). Single-pass transmembrane helices are represented by blue, rounded rectangles. GPI anchors are shown in cyan. Cytoplasmic ITIM (Immunoreceptor Tyrosine-based Inhibitory Motif) and ITAM-like (Immunoreceptor Tyrosine-based Activation Motif) motifs are highlighted in green and orange, respectively. Purple arrows indicate the CEACAMs for which several isoforms have been characterized.

Sequence analysis of the <italic toggle='yes'>ceacamz1</italic> gene and its product.

A. Organization of ceacamz1 coding region. The 35 kb-long ceacamz1 transcription unit is composed of 13 exons (red and grey boxes). The length in base pairs of the different exons and introns is indicated on the scheme. Each single Ig domain is encoded by a single exon (color-coded as in Fig 1). B. Protein sequence of CEACAMz1. The putative signal peptide is highlighted in orange and the green arrowhead indicates the most probable cleavage site (after Cys18). The Ig-V N-terminal domain is indicated in red. The Ig-C2 domains are highlighted in light grey (A-type) or dark grey (B-type). The ω-site for GPI-anchoring (Asn999) is displayed in purple. The residues highlighted in blue are cleaved off in the mature protein. C. Sequence alignment of the N-terminal Ig-V domain of CEACAMz1 with that of the twelve human CEACAMs. Amino acids are shaded from black to light grey according to their degree of conservation.

Spatial and temporal distribution of <italic toggle='yes'>ceacamz1</italic> mRNA.

A. RT-PCR analysis of ceacamz1 expression in various tissues of adult zebrafish. S: Skin; O: Ovary; I: Intestine; K: Kidney; B: Brain; T: Testis; H: Heart; M: Muscle; L: Liver; G: Gills. B. RT-PCR analysis of ceacamz1 expression during development. The developmental stages analyzed are indicated in hpf above each lane. “A” refers to adult stage (> 30 dpf). The constitutive rack1 gene was used as control in both sets of experiments.

EXPRESSION / LABELING:
Genes:
Fish:
Anatomical Terms:
Stage Range: 16-cell to Adult

Whole mount <italic toggle='yes'>in situ</italic> hybridization with specific zebrafish <italic toggle='yes'>ceacamz1</italic> RNA probes.

Larvae at 1 dpf (A-C), 2 dpf (D-F), 3 dpf (G-I) or 6 dpf (J-L). Ceacamz1 mRNA signals are detected in discrete cells around the yolk sac and yolk extension readily from 1 dpf stage (as indicated by black arrows). They also appear around the forming gills after 3 dpf stage. Scale bars: 1 mm.

EXPRESSION / LABELING:
Gene:
Fish:
Anatomical Terms:
Stage Range: Prim-5 to Day 6

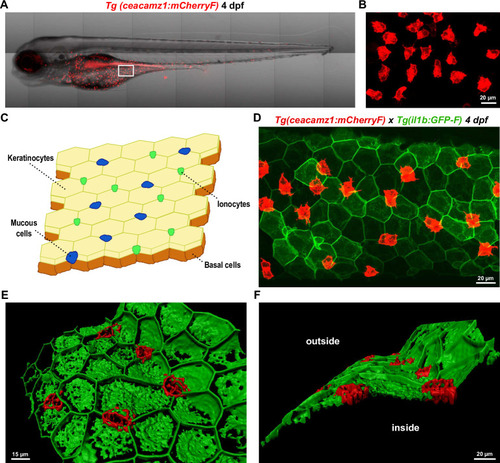
A. Live imaging of a 4 dpf Tg(ceacamz1:mCherry-F) zebrafish larva using spinning disk confocal microscopy. B. Zoom on the ventral region of the 4 dpf transgenic larva as indicated in panel A. C. Schematic representation of the cell composition of zebrafish skin epidermis at early larval stages. D. Z-projection of a portion of the ventral skin of a 4 dpf double-crossed Tg(ceacamz1:mCherry-F) x Tg(il1b:eGFP-F) zebrafish larva. CEACAMz1-expressing cells intercalate within the pavement of keratinocytes. E. and F. 3D-reconstructions of the Z-projection shown in panel D using IMARIS. Top view (E) and lateral view (F). CEACAMz1-expressing cells are embedded within the same layer as keratinocytes and they protrude on both sides of this layer.

EXPRESSION / LABELING:
Genes:
Fish:
Anatomical Terms:
Stage: Day 4

Identification of the ionocyte subtype that expresses CEACAMz1 on zebrafish epidermis.

A-C. High magnification view of the yolk sac surface of a 4 dpf Tg(ceacamz1:mCherry-F) larva (A) immunolabelled with anti-Na+/K+-ATPase antibody (B); merge of A and B (C). D-F. High magnification view of the yolk sac surface of a 4 dpf Tg(ceacamz1:mCherry-F) larva (D) immunolabelled with anti-vH+-ATPase antibody (E); merge of D and E (F). G-I. High magnification view of the yolk sac surface of a 4 dpf Tg(ceacamz1:mCherry-F) larva (G) co-stained with Alexa Fluor 488-conjugated conA (H); merge of G and H (I). (J-L) High magnification view of the gill region of a 22 dpf Tg(ceacamz1:mCherry-F) larva (J) co-stained with Alexa Fluor 488-conjugated conA (K); merge of J and K (L). At all stages analyzed, CEACAMz1-expressing cells perfectly co-localize with cells labelled by the vH+-ATPase antibody or by conA. They do not overlap at all with the cells labelled by the Na+/K+-ATPase antibody.

Evolution of CEACAMz1 expression in gills and on ventral skin at late larval stages.

Live imaging of larvae from the Tg(ceacamz1:mCherry-F) reporter line using spinning disk confocal microscopy at various developmental stages: 4 dpf (A-B), 8 dpf (C-D), 15 dpf (E-F), 21 dpf (G-H), 32 dpf (I-J). Visualization around the gill region (A,C,E,G,I) or on the ventral skin region (B,D,F,H,J).

EXPRESSION / LABELING:
Gene:
Fish:
Anatomical Terms:
Stage Range: Day 4 to Days 30-44

Distribution of CEACAMz1-positive ionocytes with respect to vasculature in the gills at late larval stages.

A. Schematic representation of a juvenile zebrafish larva to highlight the part of the gills on which imaging was performed. B. Live imaging of a 22 dpf double-crossed Tg(ceacamz1:mCherry-F) x Tg(kdr:eGFP-F) larva using spinning-disk confocal microscopy. Z-projection centred on the most posterior arch of the gills. CEACAMz1-ionocytes (red) distribute along the branchial blood vessels (green), mainly the filament arteries at this stage. C. 3D reconstruction of the most posterior branchial arch using IMARIS software. The two distinct views are rotated by 60°. CEACAMz1-expressing cells are localized along the filament arteries on the inner side of the branchial arch, i.e. along the afferent arteries. D. Schematic representation of the 3D reconstruction visualized in C. Blood vessels are color-coded according to their oxygen content (efferent arteries in red, afferent arteries in blue). HR ionocytes expressing CEACAMz1 are displayed in yellow. The direction of water flow is indicated with blue arrows and is opposite to blood flow (white arrows).

EXPRESSION / LABELING:
Genes:
Fish:
Anatomical Terms:
Stage: Days 21-29
Acknowledgments
This image is the copyrighted work of the attributed author or publisher, and ZFIN has permission only to display this image to its users. Additional permissions should be obtained from the applicable author or publisher of the image. Full text @ PLoS One