FIGURE SUMMARY
Title

Correlative microscopy and block-face imaging (CoMBI) method for both paraffin-embedded and frozen specimens

Authors
Ishii, N., Tajika, Y., Murakami, T., Galipon, J., Shirahata, H., Mukai, R., Uehara, D., Kaneko, R., Yamazaki, Y., Yoshimoto, Y., Iwasaki, H.
Source
Full text @ Sci. Rep.

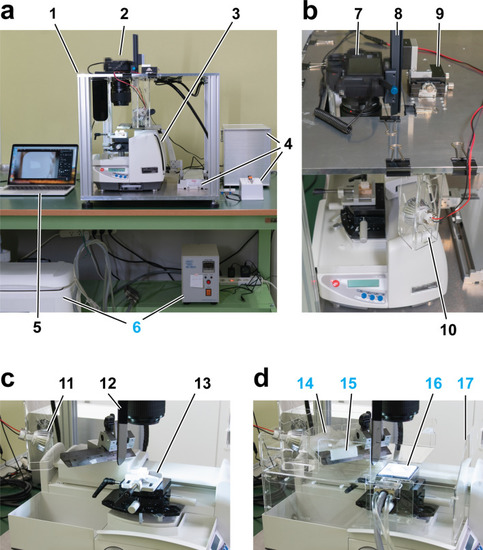
CoMBI system using a sliding microtome. CoMBI-S. (a) The front view of the whole system. The aluminum frame (1) consists of top and bottom plates and four pillars. Camera (2) is attached to the top plate. The sliding type microtome (3) is placed on the bottom plate and its handle is attached to a linear motor (4, left). A microcontroller in the box and switches regulate the linear motor and camera shutter release (4). A laptop computer is used for monitoring the block face and storing images (5). In case of frozen specimen, thermoelectric controller and ice water container are used for cooling a specimen holder (6). (b) The top view of the system. Camera (7) is attached to the top plate via focusing rail for Z positioning (8) and XY positioning stage (9). Two LED lamps at the front and back of specimen illuminate the block face diagonally (10, 11 in c). (c) The side view of the setup for paraffin-embedded specimens. The shading plate (12) and specimen holder (13) are shown. (d) The side view of the setup for frozen specimens. Dry ice for cooling knife (14), frost distributor (15), specimen holder cooling by Peltier element (16), and plastic walls for keeping the cutting environment cool (17) are shown.

Correlation between 3D image and sections of juvenile zebrafish. A juvenile zebrafish (30 dpf) is sliced at a thickness of 5 µm using CoMBI-S. (a, b) 3D volume-rendered image using 568 block-face images. (ce) Examples of block-face images. (fh) Sections were collected at the positions corresponding to (ce), and stained with hematoxylin and eosin. (ik) Higher magnification of (fh). 1: lateral forebrain bundle, 2: ventral thalamus, 3: dorsal thalamus, 4: telencephalic ventricle, 5: habenula, 6: zona limitans intrathalamica, 7: preoptic region, 8: optic nerve, 9: retina, 10: mandibular cartilage, 11: palatoquadrate ceratohyal, 12: pharynx, 13: quadrate, 14: cornea, 15: vitreous body, 16: lens, 17: retinal ganglion cell layer, 18: inner plexiform layer, 19: inner nuclear layer, 20: outer plexiform layer, 21: outer nuclear layer, 22: inner ear, 23: brainstem, 24: cranial base, 25: gill, 26: gas bladder, 27: liver, 28: intestine, 29: spinal cord, 30: vertebral body, 31: notochord remnant. Bars in (a), (f) 500 µm and (i) 250 µm.

Opacification of paraffin blocks using white agarose gel. Specimens are pre-embedded in agarose gel containing white watercolor, then dehydrated and embedded in paraffin. (a) A fly was fixed and pre-embedded in white agarose, then dehydrated and embedded in paraffin. (b) In the block face, white agarose gives opaque area around the specimen, while pure paraffin is seen as transparent area around the lump of white agarose. (ce) A fly pre-embedded in white agarose generated 276 block-face images with 4 µm-interval. A block-face image (c), a reconstructed (d), and a volume-rendered image (e) are shown. (fh) Without white agarose, structures underneath the block face are visible through the paraffin in the block-face image (* in f), and a reconstructed plane (* in g). These structures are represented in the 3D volume-rendered image as a shadow (* in h). Images in (g) and (h) were reconstructed from 351 block-face images with 4 µm-interval. (i, j) Correlation between a block-face image (i) and microscopic image of a section (j) were performed using the specimen shown in (fh). Boxed areas in (i) and (j) are magnified in the right panels. A1–A8: Abdominal segments, 1: Dorso-longitudinal muscles, 2: Dorso-ventral muscles, 3: Midgut, 4: Compound eyes, 5: Brain, 6: Head fat body, 7: Labellum. Scale bars: 200 µm.

Opacification of paraffin block using white crayon. (s) A piece of broccoli was embedded in paraffin containing 6.25% w/w white crayon and placed on the custom-made attachment (asterisk). (b) The custom-made white attachment was designed (upper image) and made using 3D printing machine (lower image). Characteristics of the attachment are the white color and the sawtooth pattern on the top, which avoid shadows and increase the area for attaching paraffin block. (c) The border between broccoli specimen and white paraffin is apparent on the block face (upper image). When the block-face image was converted to grayscale image for volume rendering, only the cutting face of the broccoli specimen is seen (lower image). (d) The serial block-face images (270 images with a voxel size of 20 × 20 × 20 µm) were converted to grayscale images (c), then used for volume rendering (d). Bars: 5 mm. The STL file of attachments is available at GitHub

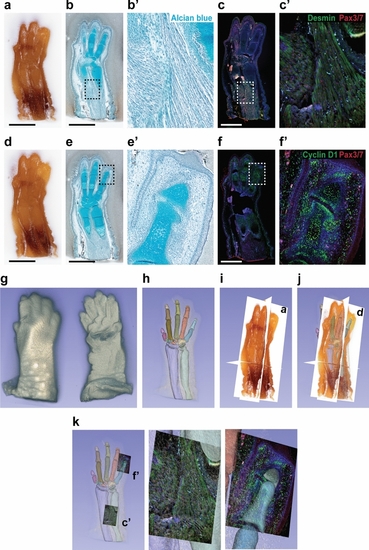
Usability of CoMBI data. Mouse forelimb on E16 were pre-embedded in white-agarose and embedded in paraffin. The 267-serial block-face images with 6-µm interval were obtained. (af) After imaging the 2 block faces shown in (a) and (d), 2 serial sections were collected and used for Alcian blue staining (b, e) or immunostaining (c, f) for desmin (green in c), cyclin D1 (green in f), Pax3/7 (red in c, f). Nuclear DNA was labeled with DAPI (blue in c, f). Boxed areas in (b, c, e, and f) are shown at higher magnification (b′, c′, e′ and f′). (g) Volume-rendered image. (h) Segmentation of cartilages. (i, j) Orthoplanes. Planes labeled with (a) and (d) are identical to block faces shown in (a) and (d). Segmented cartilage and 3D image by volume rendering are also displayed (j). (k) Fluorescent micrographs in (c′) and (f′) are shown in the original location. Bars: 1 mm.

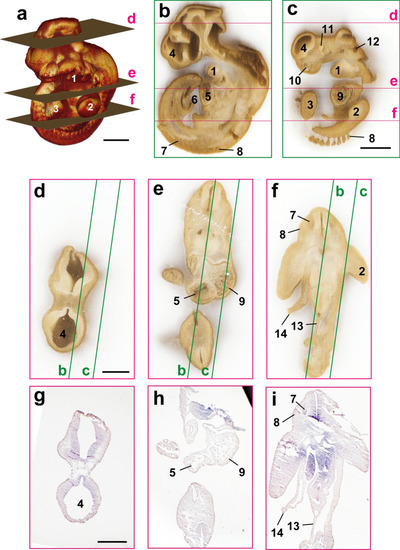
Correlation between 3D image and sections of mouse embryo on E10 in a frozen block. The mouse embryo on E10 was frozen and sliced at a thickness of 10 µm using CoMBI-S system. (a) 3D volume-rendered image using 520 block-face images shows the surface structures of the mouse embryo. (b, c) The reconstructed sagittal planes. (df) Three examples of block-face images are shown. Green lines indicated the positions of (b) and (c). (gi) Sections were collected at the positions of (df). H&E-stained sections can be correlated with block-face images in (df), and the positions where the sections were obtained are indicated as planes in (a). 1: Mandibular arch, 2: Forelimb, 3: Hindlimb, 4: Telencephalon, 5: Right ventricle, 6: Umbilical cord, 7: Dorsal root ganglion, 8: Somite, 9: Left ventricle, 10: Nasal pit, 11: Eye, 12: Otic vesicle, 13: Dorsal mesentery of hindgut, 14: Abdominal wall (broken). Bars: 1 mm (a, c), 500 µm (d, g).

Tannic acid staining improves the visibility of tissues in the frozen blocks. (ad) The eyeballs of adult ICR mouse were frozen and sliced for block-face observation. Without tannic acid staining, the retina (arrows) and lens (asterisk) are seen in white (a, b). By pre-staining with 1% tannic acid for 2 h, the retina is seen in brown with layered pattern, and the lens remains in white (c, d). The anterior and posterior spaces to the lens (aqueous and vitreous chambers) are seen in darker brown, which may reflect the remaining tannic acid solution or the shadow. (e, f) A section corresponding to the block face in d was stained with H&E, and used to identify the retinal layers; the retinal ganglion cell layer (RGCL), the inner plexiform layer (IPL), the inner nuclear layer (INL), the outer plexiform layer (OPL), the outer nuclear layer (ONL), inner and outer stripe of the photoreceptor layer (IS/OS), and retinal pigment epithelium (RPE). (g, h) The eyeball of adult C57BL5 mouse was imaged using CoMBI-S, and generated 919 block-face images with a voxel size of 2 × 2 × 4 µm. The reconstructed axial and equator planes (g) show retinal layers. The yellow and cyan lines indicate the positions of reconstructed axial and equator planes, respectively. 3D volume-rendered image (h) also shows the retina with some layers (arrows), and the lens (asterisk). (il) Mouse embryos on E10 were stained with tannic acid with indicated concentrations and staining times, then frozen. The block-face images shows that the visibility of tissues in the head region was improving, as increasing the concentration and staining time. The developing eyes in the upper panel (boxed areas) are enlarged in the lower panel. Bars in (ah) 1 mm for whole eyeball, and 100 µm for magnified images, (il) 500 µm in the upper panel, 100 µm in the lower panel.

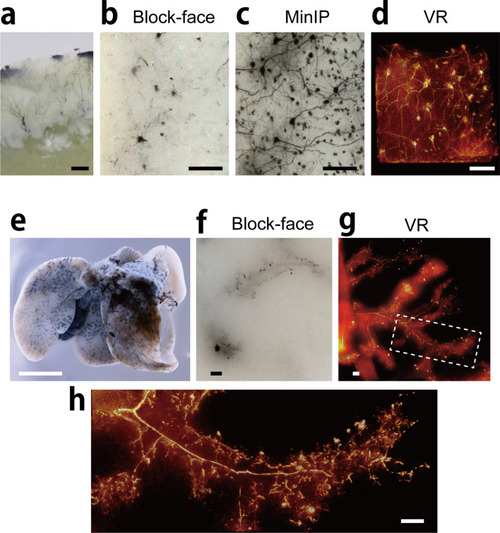
Fine 3D imaging at cellular level. (a) Mouse cerebral cortex was stained by Golgi silver impregnation method. (b) Block-face image of the stained cortex. (c, d) The minimum intensity projection (MinIP) image and volume-rendered image were generated from 201 block-face images with voxel size 0.9 × 0.9 × 1 µm. (e) Mouse liver were injected with black ink via bile duct. (f) A piece of the liver were imaged using CoMBI-S, and a block-face image is shown. (g, h) 3D volume-rendered images using 401 block-face images with voxel size of 4 × 4 × 1 µm (g) or 1 × 1 × 1 µm (h) shows the biliary tree. Bars: 100 µm (ad, fh), 5 mm (e).

Acknowledgments
This image is the copyrighted work of the attributed author or publisher, and ZFIN has permission only to display this image to its users. Additional permissions should be obtained from the applicable author or publisher of the image. Full text @ Sci. Rep.