
- Title
-
12-Lipoxygenase governs the innate immune pathogenesis of islet inflammation and autoimmune diabetes
- Authors
- Kulkarni, A., Pineros, A.R., Walsh, M.A., Casimiro, I., Ibrahim, S., Hernandez-Perez, M., Orr, K.S., Glenn, L., Nadler, J.L., Morris, M.A., Tersey, S.A., Mirmira, R.G., Anderson, R.M.
- Source
- Full text @ JCI Insight

Macrophages promote β cell loss and hyperglycemia after injury in zebrafish. (A) Schematic representation of the β cell injury assay in transgenic Tg(mpeg:eGFP);Tg(ins:NTR) zebrafish at 3 dpf, wherein islet β cells (red) are selectively destroyed upon incubation with MTZ, with the concomitant/subsequent entry of macrophages (green). (B) Representative images of islets from zebrafish treated for the times indicated with MTZ, then stained for insulin (β cells, red) and GFP (macrophages, green). Scale bar: 10 μm. (C) Free glucose measurements of whole zebrafish lysates, treated as indicated in the panel. n = 3–5 lysates per condition (20 fish per lysate), and *P < 0.05 (by 1-way ANOVA with post hoc Tukey’s test) for the corresponding values compared with untreated controls (no clodronate, no MTZ). (D) Representative images of islets from zebrafish stained for insulin (β cells, red) under the conditions indicated. Scale bar: 10 μm. (E) Quantitation of β cell number from the experiment represented in D (*P < 0.05 by unpaired 2-tailed t test). (F) Schematic representation of the β cell regeneration assay, where photoconversion of Kaede protein results in red+green (= yellow) preexisting β cells and newly formed (neogenic) β cells enter as green cells. (G) Representative images of islets from zebrafish exhibiting preexisting (yellow) and neogenic (green) β cells at 24 hours and 48 hours of recovery after MTZ treatment under the conditions (control or clodronate) indicated. Scale bar: 10 μm. (H) Quantitation of neogenic β cell number from the experiment represented in G (n = 6–7 fish/condition; *P < 0.05 by unpaired 2-tailed t test). (I) Schematic representation of the zebrafish tailfin injury assay, where tailfins of Tg(mpeg:GFP) fish at 3 dpf are mechanically cut with a blade, and the migration of macrophages (green) are observed at the site of injury. (J) Representative tailfin images of uninjured and injured zebrafish tails stained with GFP (macrophages, green) under the conditions indicated. Dotted line shows the tailfin injury site. Scale bar: 100 μm. In all panels, data are presented as mean ± SEM. GFP, green fluorescent protein; NTR, nitroreductase; Tg(mpeg:eGFP), transgenic fish containing enhanced GFP–labeled macrophages; Tg(ins:NTR), transgenic β cell NTR–expressing zebrafish; MTZ, metronidazole. PHENOTYPE:
|

Depletion or inhibition of 12-LOX protects against β cell loss in zebrafish. Zebrafish were treated with alox12 MO or the 12-LOX inhibitor ML355 prior to treatment with MTZ at 3 dpf. (A) Representative images of islets from zebrafish stained for insulin (β cells, red). (B) Quantification of β cell number in pancreatic islets of fish (expressed as % of β cells remaining relative to time 0) after MTZ treatment. n = 6–8 fish per time point. *P < 0.05 (by unpaired 2-tailed t test) for the time points indicated compared with control-treated fish. (C) Representative images of islets from control and alox12 MO zebrafish stained for insulin (β cells, red) and GFP (macrophages, green) at 24 hours after MTZ treatment. (D) Quantification of the relative number of macrophages located at the site of injured islets from the experiment shown in C (n = 9 fish per condition; *P < 0.05 by unpaired 2-tailed t test). (E) Representative images of islets from control-treated and ML355-treated zebrafish stained for insulin (β cells, red) and GFP (macrophages, green). (F) Quantification of the relative number of macrophages located at the site of injured islets from the experiment shown in E (n = 6 fish per condition; *P < 0.05 by unpaired 2-tailed t test). Scale bar: 10 μm. In all panels, data are presented as mean ± SEM. 12-LOX, 12-lipoxygenase; MO, morpholino; MTZ, metronidazole; GFP, green fluorescent protein. PHENOTYPE:
|
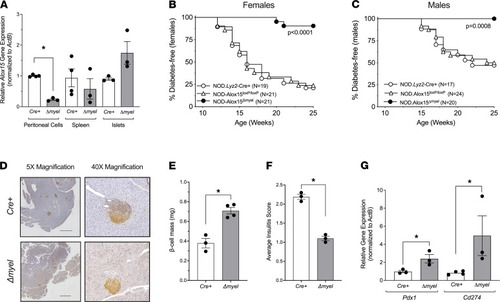
Protection from diabetes after myeloid-specific deletion of Alox15 in NOD mice. NOD mice harboring the Lyz2-Cre allele were crossed to NOD mice harboring Cre recombinase sites (Loxp) flanking exons 2–5 of the Alox15 gene to generate NOD:Alox15Δmyel mice (Δmyel). NOD:Lyz2-Cre (Cre+) and NOD:Alox15Loxp/Loxp littermates were used as controls. (A) Alox15 mRNA expression in peritoneal cells, spleen, and isolated islets (n = 3–4 per tissue); *P < 0.05 by unpaired 2-tailed t test. (B) Diabetes incidence in female mice. Number of mice per group is indicated. P value indicates significance by log rank test. (C) Diabetes incidence in male mice. Number of mice per group is indicated. P value indicates significance by log rank test. (D) Representative IHC images of mouse pancreata from Cre+ and Δmyel mice immunostained for insulin (brown) and counterstained with hematoxylin (blue). Scale bar: 1000 μm. (E) β Cell mass in Cre+ and Δmyel mice (n = 3–4 mice per genotype). (F) Insulitis scoring from pancreata of Cre+ and Δmyel mice (n = 3 mice per genotype). (G) Gene expression in isolated islets from Cre+ and Δmyel mice (n = 3 mice per genotype). For E–G, *P < 0.05 by unpaired 2-tailed t test. All data are presented as mean ± SEM. |
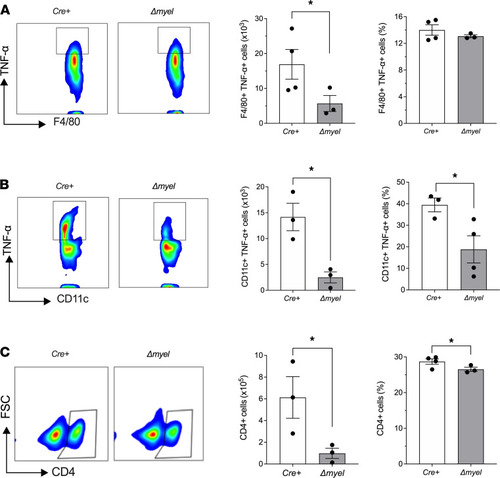
Reduced proinflammatory myeloid cell populations and CD4 T cells in pancreatic lymph nodes of NOD:Alox15Δmyel mice. Pancreatic lymph nodes were isolated from NOD:Lyz2-Cre (Cre+) control mice and NOD:Alox15Δmyel (Δmyel) mice at 8 weeks of age and subjected to flow cytometry analysis. (A) Representative contour plot showing gating of F4/80+ TNF-α+ cells (left), total number of F4/80+ TNF-α+ cells (middle), and F4/80+ TNF-α+ cells as a percentage of total cells (right; n = 3–4 mice per genotype; *P < 0.05 by unpaired 2-tailed t test). (B) Representative contour plot showing gating of CD11c+ TNF-α+ cells (left), total number of CD11c+ TNF-α+ cells (middle), and CD11c+ TNF-α+ cells as a percentage of total cells (right; n = 3–4 mice per genotype; *P < 0.05 by unpaired 2-tailed t test). (C) Representative contour plot showing gating of CD4+ cells (left), total number of CD4+ cells (middle), and CD4+ cells as a percentage of total cells (right; n = 3–4 mice per genotype; *P < 0.05 by unpaired 2-tailed t test). All data are presented as mean ± SEM. |
( PHENOTYPE:
|

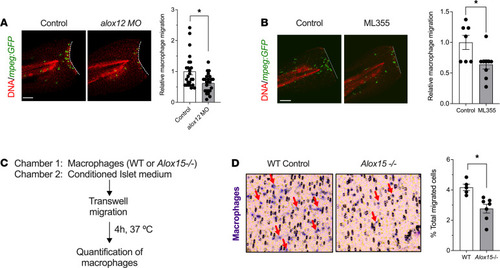
Depletion or inhibition of 12-LOX impairs macrophage migration in zebrafish and mice. (A) Control and alox12 MO-treated Tg(mpeg:GFP) zebrafish underwent tailfin injury at 3 dpf. Representative images of injured zebrafish tails stained with GFP (macrophages, green) and TO-PRO3 (nuclei, red) are shown on the left and quantitation of relative number of migrating macrophages is shown on the right (n = 22–24 fish per condition; *P < 0.05 by unpaired 2-tailed t test). (B) Tg(mpeg:eGFP) zebrafish were treated with vehicle or 10 μM ML355 and then underwent tailfin injury at 3 dpf. Representative images of injured zebrafish tails stained with GFP (macrophages, green) and TO-PRO3 (nuclei, red) are shown on the left and quantitation of relative number of migrating macrophages is shown on the right (n = 7–9 fish per condition; *P < 0.05 by unpaired 2-tailed t test). (C) Description of the chemotaxis assay in vitro using WT and Alox15–/– mouse peritoneal macrophages. (D) Representative images of the porous membrane showing migrating methylene blue–stained macrophages (red arrows) is shown on the left, and quantitation of the number of migrating macrophages is shown on the right (n = 5–7 independent experiments; *P < 0.05 by unpaired 2-tailed t test). Scale bar: 50 μm. All data are presented as mean ± SEM. 12-LOX, 12-lipoxygenase; Tg(mpeg:eGFP), transgenic fish containing enhanced GFP–labeled macrophages; GFP, green fluorescent protein. |

CXCR3 is reduced in the absence of 12-LOX. (A) Chemokine receptor mRNA expression in macrophages from WT and Alox15–/– mice (n = 3–4 mice per genotype; *P < 0.05 by unpaired 2-tailed t test). (B) Representative contour plots showing gating of F4/80+ CXCR3+ cells are shown on the left and F4/80+ CXCR3+ cells as a percentage of total peritoneal cells from WT and Alox15–/– mice are shown on the right (n = 3 mice per genotype; *P < 0.05 by unpaired 2-tailed t test). (C) cxcr3.2 mRNA expression from whole lysates of control-treated and alox12 MO-treated zebrafish (n = 4 independent experiments from pooled zebrafish larvae; *P < 0.05 by unpaired 2-tailed t test). (D) Representative images of injured Tg(mpeg:eGFP) zebrafish tailfins stained with GFP (macrophages, green) and TO-PRO3 (nuclei, red) are shown on the left; and corresponding quantitation of relative number of macrophages at the tail injury site in the control, alox12 MO–injected fish, fish injected with a vector for macrophage-specific overexpression of cxcr3.2, and fish coinjected with alox12 MO and vector for macrophage-specific overexpression of cxcr3.2 is shown on the right (n = 20–30 fish per condition; *P < 0.05 by 1-way ANOVA with post hoc Tukey’s test). (E) Representative images of injured Tg(mpeg:eGFP) zebrafish tailfins stained with GFP (macrophages, green) and TO-PRO3 (nuclei, red) are shown on the left, and corresponding quantitation of relative number of macrophages at the tail injury site in the vehicle control and BLT2 inhibitor LY255283-treated fish is shown on the right (n = 20–25 fish per condition; *P < 0.05 by 1-way ANOVA with post hoc Tukey’s test). Scale bars in D and E indicate 100 μm. (F) Cxcr3 mRNA expression in mouse peritoneal cells treated with 10 μM LY255283 for 24 hours (cells from n = 5 mice per condition; *P < 0.05 by unpaired 2-tailed t test). (G) F4/80+CXCR3+ cells as a percentage of total peritoneal cells by flow cytometry after treatment with 10 μM LY255283 for 24 hours (cells from n = 5 mice per condition; *P < 0.05 by unpaired 2-tailed t test). Data are presented as mean ± SEM. 12-LOX, 12-lipoxygenase; MO, morpholino; GFP, green fluorescence protein; Tg(mpeg:eGFP), transgenic fish containing eGFP-labeled macrophages. |