
|
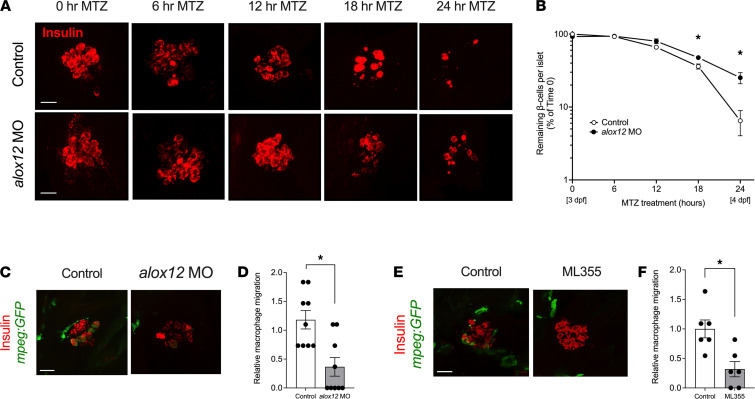
Figure 2 Depletion or inhibition of 12-LOX protects against β cell loss in zebrafish. Zebrafish were treated with alox12 MO or the 12-LOX inhibitor ML355 prior to treatment with MTZ at 3 dpf. (A) Representative images of islets from zebrafish stained for insulin (β cells, red). (B) Quantification of β cell number in pancreatic islets of fish (expressed as % of β cells remaining relative to time 0) after MTZ treatment. n = 6–8 fish per time point. *P < 0.05 (by unpaired 2-tailed t test) for the time points indicated compared with control-treated fish. (C) Representative images of islets from control and alox12 MO zebrafish stained for insulin (β cells, red) and GFP (macrophages, green) at 24 hours after MTZ treatment. (D) Quantification of the relative number of macrophages located at the site of injured islets from the experiment shown in C (n = 9 fish per condition; *P < 0.05 by unpaired 2-tailed t test). (E) Representative images of islets from control-treated and ML355-treated zebrafish stained for insulin (β cells, red) and GFP (macrophages, green). (F) Quantification of the relative number of macrophages located at the site of injured islets from the experiment shown in E (n = 6 fish per condition; *P < 0.05 by unpaired 2-tailed t test). Scale bar: 10 μm. In all panels, data are presented as mean ± SEM. 12-LOX, 12-lipoxygenase; MO, morpholino; MTZ, metronidazole; GFP, green fluorescent protein.